Just recently there has been renewed fervor in discussions about pricing of risk. Credit yield spreads have been a key focus item. Let’s add the spread between domestic stock dividend yield and domestic interest rates to the grist.
The following chart shows the weekly 12-month moving average of the S&P 500 dividend yield, the 3-month Treasury interest rate and the long-term Treasury interest rate (20-Year through 30-Year T-Bond variously — see Data Note below).
[click image to enlarge] 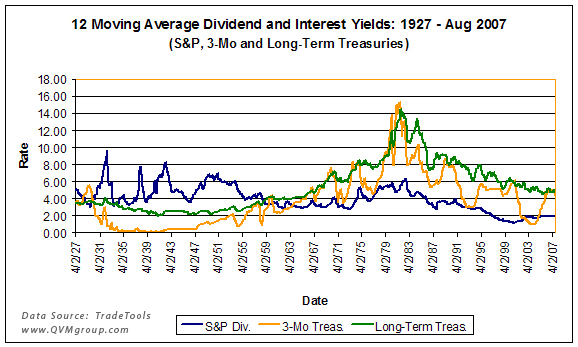
A more interesting chart presents the ratio of the S&P dividend yield to the long-term Treasury bond interest rate, as shown below.
[click image to enlarge]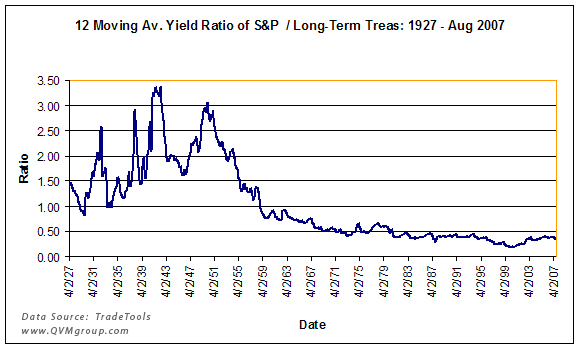
Something pretty dramatic happened in the 1950’s that inverted the ratio such that equity dividend yields went from greater than long-term government bond interest rates to less than long-term government bond rates.
We don’t really know why that happened, but we believe it may be an important question. Was the condition before the inversion the “normal” condition, or is the condition since the 1950’s "normal"? Is the condition cyclical?
Some cycles are very long. Is this ratio in a long-term cycle? Are the forces that caused the inversion still in effect? Are they diminishing? Could the pre-1950’s ratios come back? What could make that happen?
Clearly, the ratio has something to do with pricing of risk. Will the current repricing of risk due to credit problems impact the ratio? Will the decline of the dollar impact the ratio? Will the ascendancies of China and India change the ratio? Will the fact that the U.S. stock market is no longer the majority of world market-cap impact the ratio?
We don’t know the answers, but we think the question deserves attention in due course. We hope to find a market historian who can shed light on the causes of