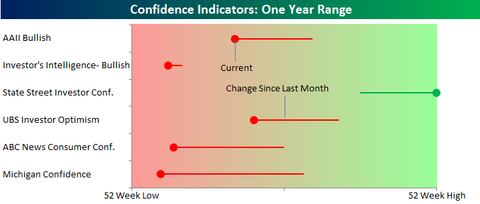
In the graph below we have summarized the one year range of some of the major confidence and sentiment indicators that investors follow. Green lines indicate that the survey is showing an increase in confidence/bullishness over the last month, while red lines indicate a decrease in confidence/bullishness.
As the chart illustrates, all but one of the indicators highlighted have recently been showing a decrease in confidence over the last month with the exception of the State Street Investor Confidence Index. Interestingly, while all the other indicators simply ask how investors or consumers feel, the State Street index is the only one which claims to measure how investors are actually investing.
