Dividend Payers vs. Non-Payers, August Performance

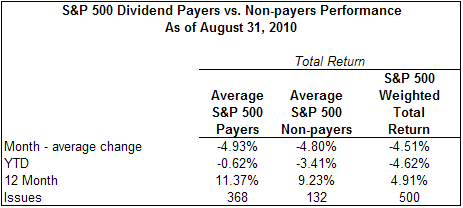
Although the month of August saw the average return for the dividend payers in the S&P 500 Index trail the non-payers and the S&P 500 Index as a whole, on a YTD and 12-month basis, the payers continue to outperform. On a year to date basis, the average return of the payers equals -.62% versus -3.41% for the non payers. On an average return basis, the payers and non payers are outperforming the market cap weighted S&P 500 Index. The fact that the equal weighted returns are outperforming the market cap weighted returns continues to support the findings in the July 2010 report issued by Standard and Poor's. ()
From The Blog of HORAN Capital Advisors

Source: Standard & Poor's

This article was written by

HORAN Wealth LLC is an SEC registered investment advisor that manages investment portfolios for individuals and institutions. Our firm utilizes a disciplined investing approach that should create wealth for our clients over time. Our investment bias is to invest in companies that generate a steady return over time, i.e., singles and doubles. This singles and doubles approach tends to lead to investments in higher quality dividend growth/cash flow growth companies. On the other hand, there are times when a company's stock price seems to be trading below its fair valuation. Short term gains are possible in these situations. I have been managing investment portfolios for individuals and institutions for over fifteen years and believe investing is like running a marathon and not a sprint. Taking the road less traveled, more often than not, leads to higher returns. Visit: The Blog of HORAN Capital Advisors at (https://horanwealth.com/insights/market-commentary-blog)

Recommended For You

About AOD Ticker

SymbolLast Price% Chg
Expense Ratio
Div Frequency
Div Rate
Yield
Assets (AUM)
Volume
Compare to Peers

More on AOD

Related Stocks

SymbolLast Price% Chg
AOD
--