After evaluating Home Depot (NYSE:HD), it's only natural that I look at its main competitor Lowe's (NYSE:LOW) for comparison purposes. I like both home-improvement retailers, as I think (subjectively) that they both maintain much better immunity to Amazon-related threats than many traditional retailers, largely due to the nature of their business and even the weight and dimensions of much of their merchandise. Home Depot's moat came through in the numbers, so I'd like to know if the numbers tell a similar story for Lowe's as well, especially since it's priced at a discount to its bigger competitor.
Return on equity, with a slight twist
Right off the bat, LOW looks inferior to HD by a wide margin when comparing 'headline' ROE's. I built the below DuPont analysis using data from Lowe's financial statements to help illustrate the disparity.
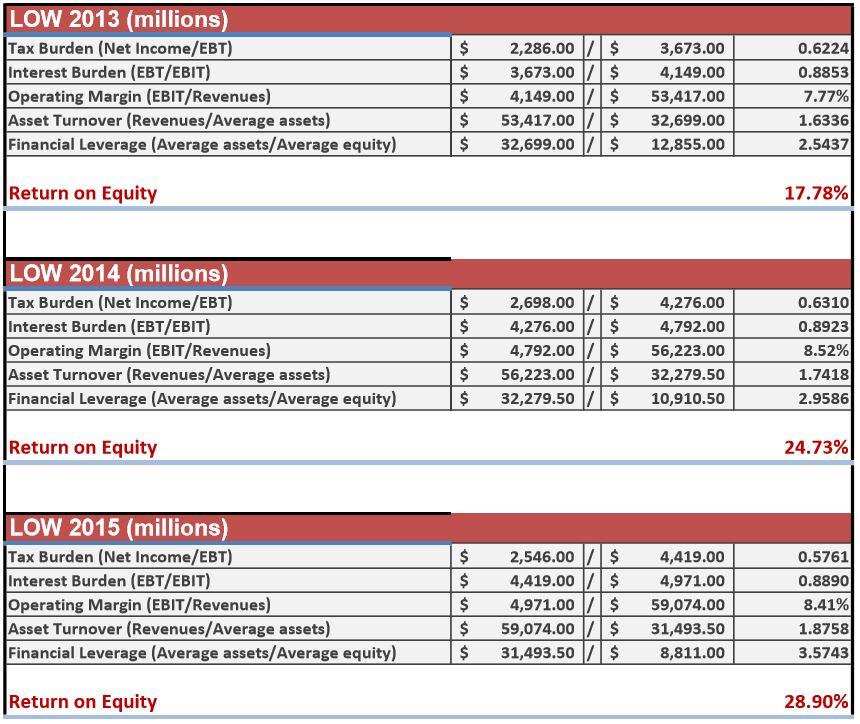
As I explained in my article on Home Depot, however, much of this has to do with leverage. Home Depot has been loading up on debt, and I think its 'true' ROE is probably closer to the 34% to 42.5% range. Still, I'd say its underlying ROE is more-than-likely still superior to that of Lowe's, judging by Home Depot's better operating margins and asset turnover.
While both company's have been shrinking their equity (one of the major forces driving ROE-magnifying leverage higher), Home Depot is actually continuing to increase its retained earnings.
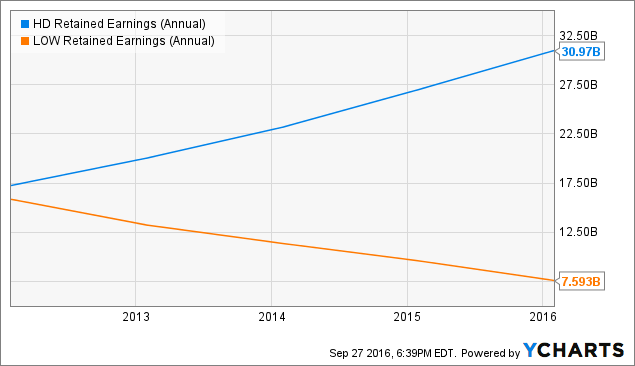
HD Retained Earnings (Annual) data by YCharts
I like companies that generate high returns on equity, while also increasing retained earnings, and Home Depot better fits this description.
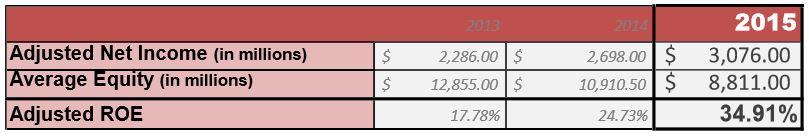
There's also another twist to the story, however, as a one-time charge distorted LOW's fiscal 2015 results:

Source: LOW 2015 10-K
Backing out this charge, and I'd say that 'adjusted' ROE is closer to the below figure.
But what about leverage? If we