Natural Gas Weekly: Market Balance And Evolution Of Storage Forecasts

Mar. 31, 2017 3:18 AM ET, , , , , , , , , , , , , , , , , 1 Comment

Summary

  • Total demand for American natural gas fell for the second week in a row.
  • The market is less concerned about mid-term fundamentals; more focused on the structured imbalance.
  • Injections in the next two reports are expected to be above last year’s level.

This report covers the week ending March 31, 2017. Daily data for March 24 to March 30 is estimated. Daily data to March 31 is forecast.

Total Supply/Demand Balance

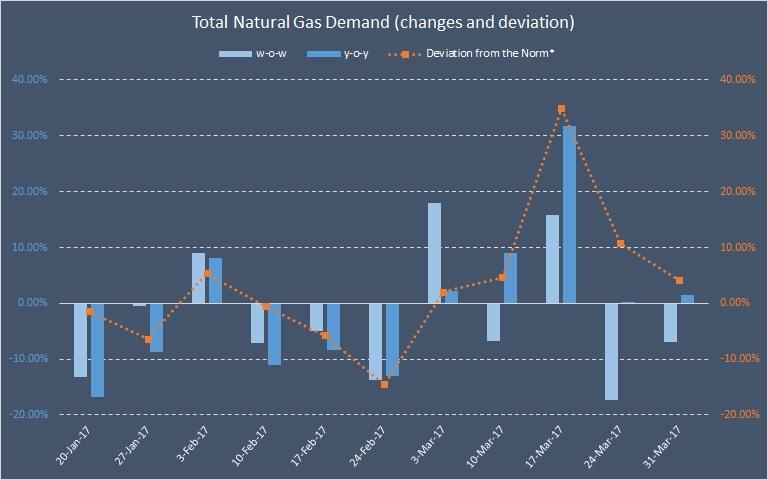
We estimate that total demand for American natural gas fell to around 495-497 bcf this week (down 7% w-o-w, but up 1.4% y-o-y). National consumption continued to decline in annual terms, but exports' contribution completely offset this trend. Pipeline nominations to Mexico and Canada are up more than 10% y-o-y, while liquefaction demand surged by more than 400% over the same period due to a very low comparison base. The deviation from the norm decreased from just over +10% last week to around +4% this week.

Total Natural Gas Demand

Source: GeckoiCapital

* norm defined as simple average over the last nine years

Due to seasonal pipeline maintenance, production was weaker than last week. Imports from Canada also declined and total aggregate supply was down some 2% y-o-y. Overall, total SD Balance is expected to be positive at no less than 50 bcf, which is some 23 bcf above 5-year average for this time of the year. Please note, that total SD Balance does not equal storage flows.

Total Natural Gas Balance

Source: GeckoiCapital

Storage

Today's EIA report came exactly in line with our expectations of -43 bcf. Although our first publicly released estimate was -40 bcf, we revised it to -43 bcf this Tuesday. As we said in our previous Natural Gas Weekly: "traders may wish to rethink their excessively bullish expectations." That is exactly what they did. According to ICE reports, the expectations for the total of four reports went up from +14 bcf on March 22 to +26 bcf on March 27. Our expectations gap indicator has, therefore, narrowed. However, that narrowing was not accompanied by a corresponding decline in price, which is surprising. The reason is probably that the market

This article was written by

5.26K Followers
Bluegold Trader (BGT) is an independent provider of public market information and trading analytics. BGT is a one-stop shop for all your research needs in energy and forex trading.

Analyst’s Disclosure:I/we have no positions in any stocks mentioned, and no plans to initiate any positions within the next 72 hours. I wrote this article myself, and it expresses my own opinions. I am not receiving compensation for it (other than from Seeking Alpha). I have no business relationship with any company whose stock is mentioned in this article.

Seeking Alpha's Disclosure: Past performance is no guarantee of future results. No recommendation or advice is being given as to whether any investment is suitable for a particular investor. Any views or opinions expressed above may not reflect those of Seeking Alpha as a whole. Seeking Alpha is not a licensed securities dealer, broker or US investment adviser or investment bank. Our analysts are third party authors that include both professional investors and individual investors who may not be licensed or certified by any institute or regulatory body.

Recommended For You

Related Stocks

SymbolLast Price% Chg
USO--
United States Oil Fund, LP ETF
OIL-OLD--
iPath S&P GSCI Crude Oil Total Return Index ETN
UCO--
ProShares Ultra Bloomberg Crude Oil ETF
SCO--
ProShares UltraShort Bloomberg Crude Oil ETF
BNO--
United States Brent Oil Fund, LP ETF

Related Analysis