Gold and silver began pulling back early last week towards our first support level near $1,310. Following the FOMC minutes release, December gold futures fell below our next support level of $1,300, only to recover later in the week back above that key level. This $1,300 level has been key resistance in the recent past, will it become a key support moving forward?

I'm a long-term bull for gold and silver, and hold 5-10% of my investable assets in physical vaulted gold and silver. I believe that the fiat money system is a house of cards that grows more precarious each year. Nevertheless, I also recognize that short-term price movements in gold and silver are not dependent upon their (eventual) monetary value.
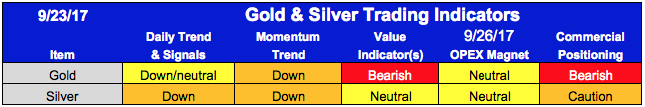
Gold is money. However, it is currently traded as a paper commodity. I can’t (and won’t attempt to) predict the day that gold will be set free from its paper chains. Until then, I seek to hedge my physical stack by occasionally shorting gold and silver at apparent inflection points. To do this, I follow five key indicators, the current status of which is shown below. I cover these indicators on a daily and weekly basis in my Seeking Alpha Marketplace service. Below, I will focus on a few key charts and the Commitment of Traders report. If you are interested in learning more about other indicators, you can read an introduction here.
Dollar, Yen and GLD
The dollar may finally be showing signs of a bottom, which should make conceptual sense with the Fed tightening and other advanced economies - Europe and Japan - maintaining their loose monetary policy. A stronger dollar (which would be represented by the chart below reversing trend) is of course generally negative for all products - like gold - that are priced in dollars.