For two months, the price of gold moved steadily higher rising from a low of $1211.10 per ounce on July 10 to a high of $1362.40 on September 8. The gradual move that took the yellow metal over $150 higher was slow and steady without too much drama of big dips or spikes to the upside. The appreciation over the period amounted to a crawl higher. Over the period, gold averaged a little more than a $2.50 per day gain.
A pair of flash crashes in June, and early July took gold to its July 10 low. Large selling orders during typically illiquid hours for COMEX futures during early European and Asian trading caused the price of gold to spike lower. However, gold rallied for several reasons from that July 10 bottom. The dollar index has been moving appreciably lower throughout 2017, and during the summer it approached critical support at the 91.88 level on the index. A weaker dollar tends to be supportive for the prices of gold and other precious metals. Additionally, the geopolitical landscape became a source of fear and uncertainty particularly surrounding events on the Korean Peninsula. Gold reached its most recent high earlier this month, and since then the price has been correcting to the downside.
Gold fails just $15.10 below the 2016 high
On September 8, gold reached a high of $1362.40 on the active month December futures contract. 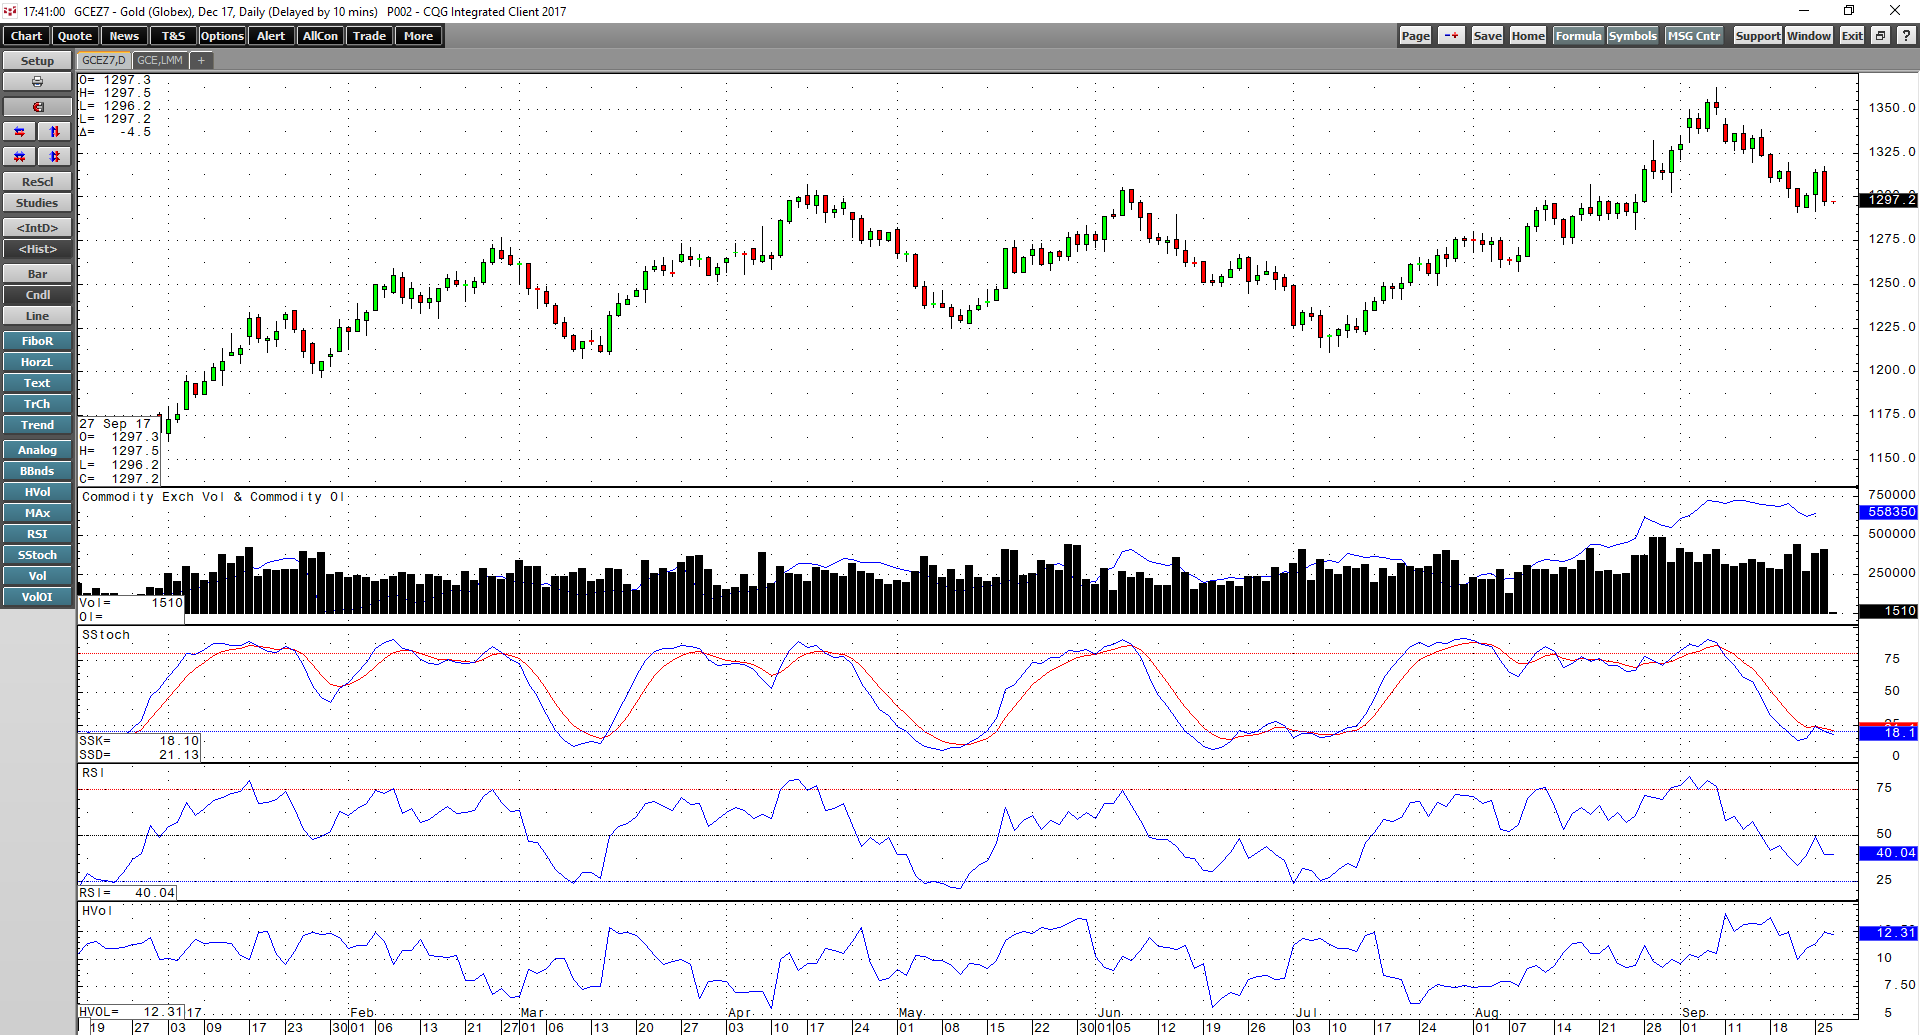 Source: CQG
As the daily chart highlights, the yellow metal ran out of steam at the early September high and has been falling since.  Source: CQG
The weekly chart illustrates that gold made a run at the high of $1377.50 from back in July 2016 and the December contract came within $15.10 of that level. However, the precious metal could not muster the strength to challenge the critical level