Has Gold Found A Bottom?

Oct. 09, 2017 2:50 PM ET, , , , , , , , , , , , , , , , , , , , , 12 Comments
Viking Analytics
4.64K Followers

Summary

  • Gold remains in a well-defined daily uptrend channel, and the recent sell-off can be best viewed as a correction.
  • I review signs that a bottom has formed in gold.
  • Gold bulls might want GLD to form a bottom near $118 in order to further solidify the current uptrend, but the bottom could be in place already.

Introduction

Gold remains in a well-defined daily up-trend channel that began in late 2016. The upward trend is bullish until proven otherwise. Over the past month, however, gold and the SDPR Gold Trust (GLD) have been falling in a well-defined trend channel. On Friday, the U.S. jobs report showed that (in part due to hurricanes) the U.S. lost jobs for the first time in many years. Gold immediately sold off, before recovering to finish the week just below even. The recovery in prices began right after the 10 am EST London gold market “fix” (how about that?). Gold bulls are looking for a bottom. Have they found one yet?

Source: Coppertone

While there is evidence that a bottom is forming (especially in the silver price), I personally would like to see more confirmation before initiating a long swing trading position in gold. I do anticipate that we will see a bottom this week, whether it comes earlier in the week or later. However, I believe that gold bulls should prefer to see a support in GLD hold at $118 before resuming the uptrend.

I'm a long-term bull for gold and hold 5-10% of my investable assets in vaulted precious metals. Gold is money. However, it is currently traded as a paper derivative. I can’t (and won’t attempt to) predict the day when gold will be set free from its paper chains. Until then, I will occasionally hedge my physical stack by shorting gold and silver at apparent inflection points. Or, I add long exposure when my indicators and the trend turns upward. In my approach to swing trading, I keep an eye on five indicators, which are shown below.

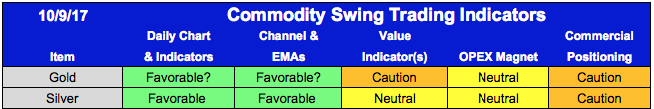
Two of the indicators above are proprietary: the OPEX magnet calculations and the value indicators. These are updated on a daily basis for

This article was written by

4.64K Followers
Systematic and quantitative analysis.Rob McBride has 15+ years of experience in the systematic investment space and is a former Managing Director at a $14 Billion hedge fund. Rob has deep experience with market data, software and model building in financial markets. Erik Lytikainen has 25+ years of experience as an entrepreneur, business developer and financial analyst. He founded Viking Analytics in 2015 after selling a commodity production & trading company he co-founded in 2006.

Analyst’s Disclosure:I/we have no positions in any stocks mentioned, and no plans to initiate any positions within the next 72 hours. I wrote this article myself, and it expresses my own opinions. I am not receiving compensation for it (other than from Seeking Alpha). I have no business relationship with any company whose stock is mentioned in this article.

Seeking Alpha's Disclosure: Past performance is no guarantee of future results. No recommendation or advice is being given as to whether any investment is suitable for a particular investor. Any views or opinions expressed above may not reflect those of Seeking Alpha as a whole. Seeking Alpha is not a licensed securities dealer, broker or US investment adviser or investment bank. Our analysts are third party authors that include both professional investors and individual investors who may not be licensed or certified by any institute or regulatory body.

Recommended For You

Related Stocks

SymbolLast Price% Chg
GDX--
VanEck Gold Miners ETF
GDXJ--
VanEck Junior Gold Miners ETF
GLD--
SPDR® Gold Shares ETF
IAU--
iShares Gold Trust ETF
PHYS--
Sprott Physical Gold Trust

Related Analysis