The name of the game over the next few months is to identify the winner that stands a better chance to outperform during the market transition. In that respect, I have started looking at various regional banks, having covered a few banks in Texas and Hawaii, I am drawing my attention to a region not particularly known to be an economic powerhouse.
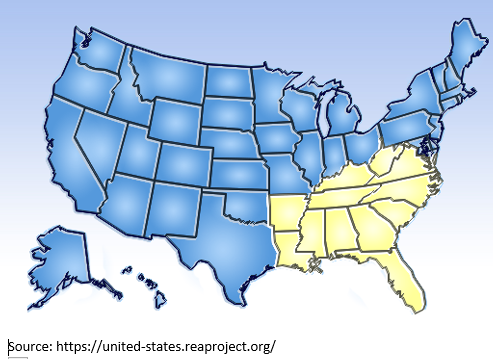
The Southeastern United States as defined by the American Association of Geographers is comprised of: Alabama, Florida, Georgia, Kentucky, Mississippi, North Carolina, South Carolina, Tennessee, Maryland, Virginia, and West Virginia as highlighted below.
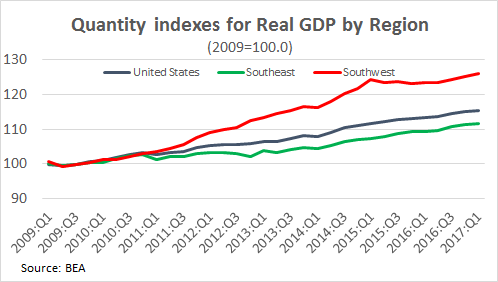
This region is one of the weakest in the US, with the region's "recovery" lagging the national average starting from 2010 to present as is evident in the chart below.
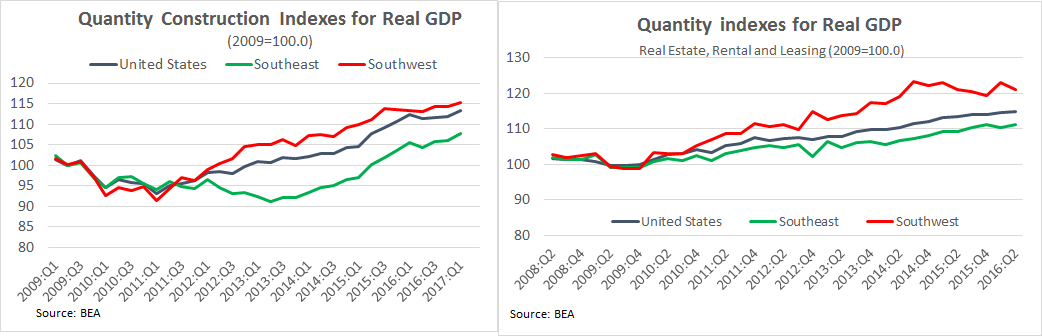
While the national construction boomed post the great recession starting in 2011 and getting back to the 2009 levels by the end of 2012, for the Southeast region, construction levels did not recover to 2009 levels until 2015! It is interesting to mention that the real estate portion of the GDP also lagged the national average.
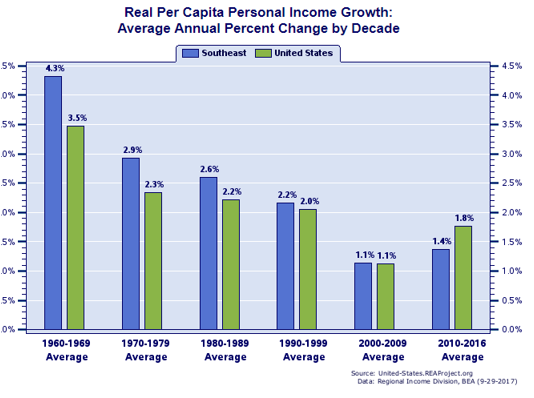
 What stands out is the deviation in real per capita personal income growth over the years. Relative to nationwide real per capita personal income growth trends, the Southeast led the nation during the 1960s (4.32% vs. 3.48%), outpaced the nation over the 1970s (2.92% vs. 2.34%), exceeded the nation in the 1980s (2.59% vs. 2.21%), outpaced the nation during the 1990s (2.16% vs. 2.05%), exceeded the nation throughout the 2000s (1.14% vs. 1.12%), and trailed the nation over 2010-2016 (1.37% vs. 1.76%).
A report by the Atlanta Fed published on March 2017, breaks down the overall lending environment in the US as of the end of 2016. It is not a surprise that lending has been falling in 2017 versus