Chart Of The Week: DM Equity Risk Premiums

Mar. 19, 2018 7:01 PM ET, , , , , , , , , , , , , , , , , , , , , , , , , , , ,
Topdown Charts
4.78K Followers

Summary

  • The equity risk premium provides a unique perspective on valuation, which brings in absolute valuations, while also reflecting the opportunity cost or trade-off vs less risky assets.
  • There is a compelling relative value case for UK equities.
  • The US ERP has come down significantly, but remains above where the previous major market tops occurred.

This week the "Chart of the Week" shows the equity risk premium across a couple of key developed economy stockmarkets. The equity risk premium provides a unique perspective on valuation, which brings in not just what's going on with absolute valuations, but also reflects the opportunity cost or trade-off vs less risky assets. This makes it of particular interest to asset allocators.

The chart in particular shows the equity risk premium [ERP] for the UK, as compared to the US and the rest of DM (developed markets), and comes from a

report on the contrarian case for UK equities

. The main conclusion is, that solely on an ERP basis the UK is among the most attractively valued DM equity markets. While it is only one factor, the 500 basis point spread vs the US ERP is certainly something to talk about.

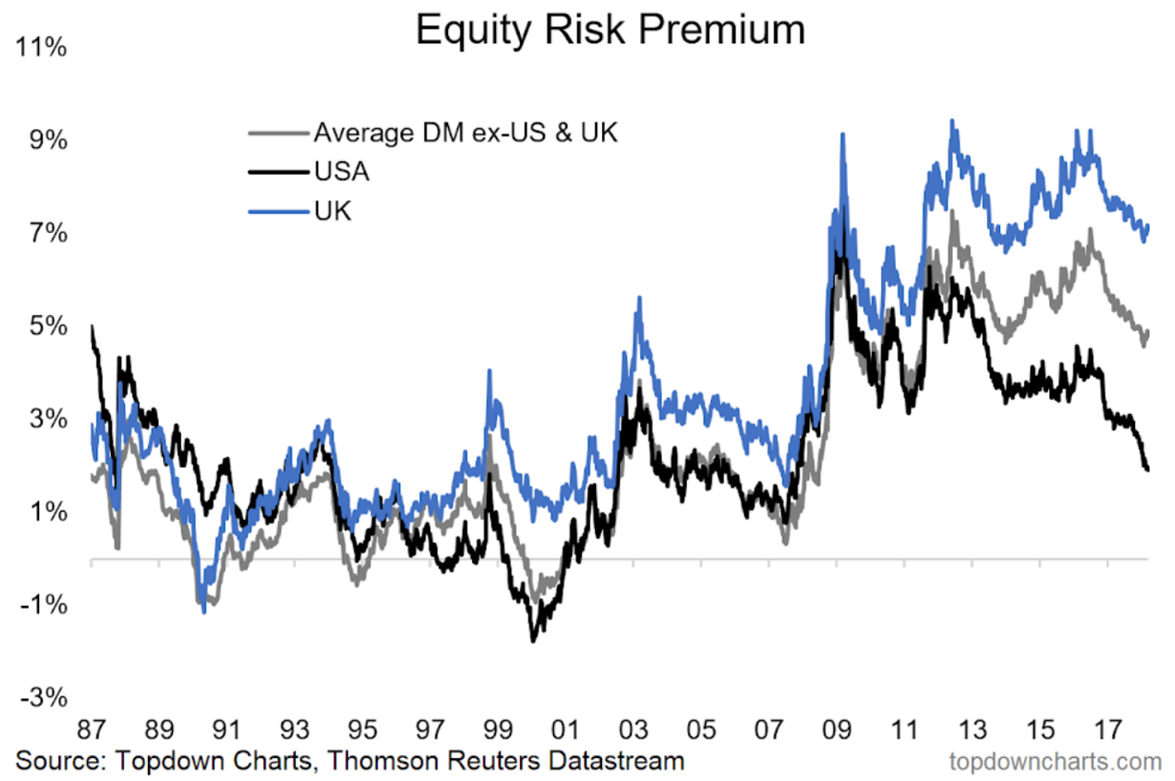
There are dozens of ways to calculate the equity risk premium, and in this case the formula I have used is ERP = (1/PE10) - (10yr Gov't Bond Yield - 10yr CPI CAGR). In other words, the earnings yield using 10-year average earnings minus the real yield where the real yield is the 10-year government bond yield minus the 10-year inflation rate (10-year rolling CPI compound annual growth rate). I have used the government bond yield of the domestic market, so for the UK market it is the 10-year yield on gilts.

Aside from the relative value case for the UK, it's also interesting to note how much the US ERP has come down - both as a result of more expensive equity market valuations, and steadily higher bond yields. While the US ERP is slightly below average, it is still comfortably higher than either the 2007 top or the particularly extreme case of 2000. And though it is higher than these previous major tops, it

This article was written by

4.78K Followers
Topdown Charts is an independent research firm covering global asset allocation and economics - bringing a chart-driven, top-down approach to investors.  -->> Check out our new entry-level service: https://topdowncharts.substack.com/--We take a top-down, global multi-asset perspective to deliver:Actionable investment ideasRisk management inputMeaningful macro insightsCharts to use in your own work--Our clients include Pension companies, RIAs, Hedge Funds, family offices, insurance firms, and wealth managers and Investment Consultants.--Sign up for exclusive insights:  https://topdowncharts.substack.com/===================================================

Analyst’s Disclosure:I/we have no positions in any stocks mentioned, and no plans to initiate any positions within the next 72 hours. I wrote this article myself, and it expresses my own opinions. I am not receiving compensation for it. I have no business relationship with any company whose stock is mentioned in this article.

Seeking Alpha's Disclosure: Past performance is no guarantee of future results. No recommendation or advice is being given as to whether any investment is suitable for a particular investor. Any views or opinions expressed above may not reflect those of Seeking Alpha as a whole. Seeking Alpha is not a licensed securities dealer, broker or US investment adviser or investment bank. Our analysts are third party authors that include both professional investors and individual investors who may not be licensed or certified by any institute or regulatory body.

Recommended For You

Related Stocks

SymbolLast Price% Chg
SPY--
SPDR® S&P 500® ETF
VOO--
Vanguard S&P 500 ETF
SH--
ProShares Short S&P500 ETF
SDS--
ProShares UltraShort S&P500 ETF
IVV--
iShares Core S&P 500 ETF

Related Analysis