What do you see when you glance at the corporate balance sheet for IBM (NYSE:IBM)? (Screenshot from CNBC.Com)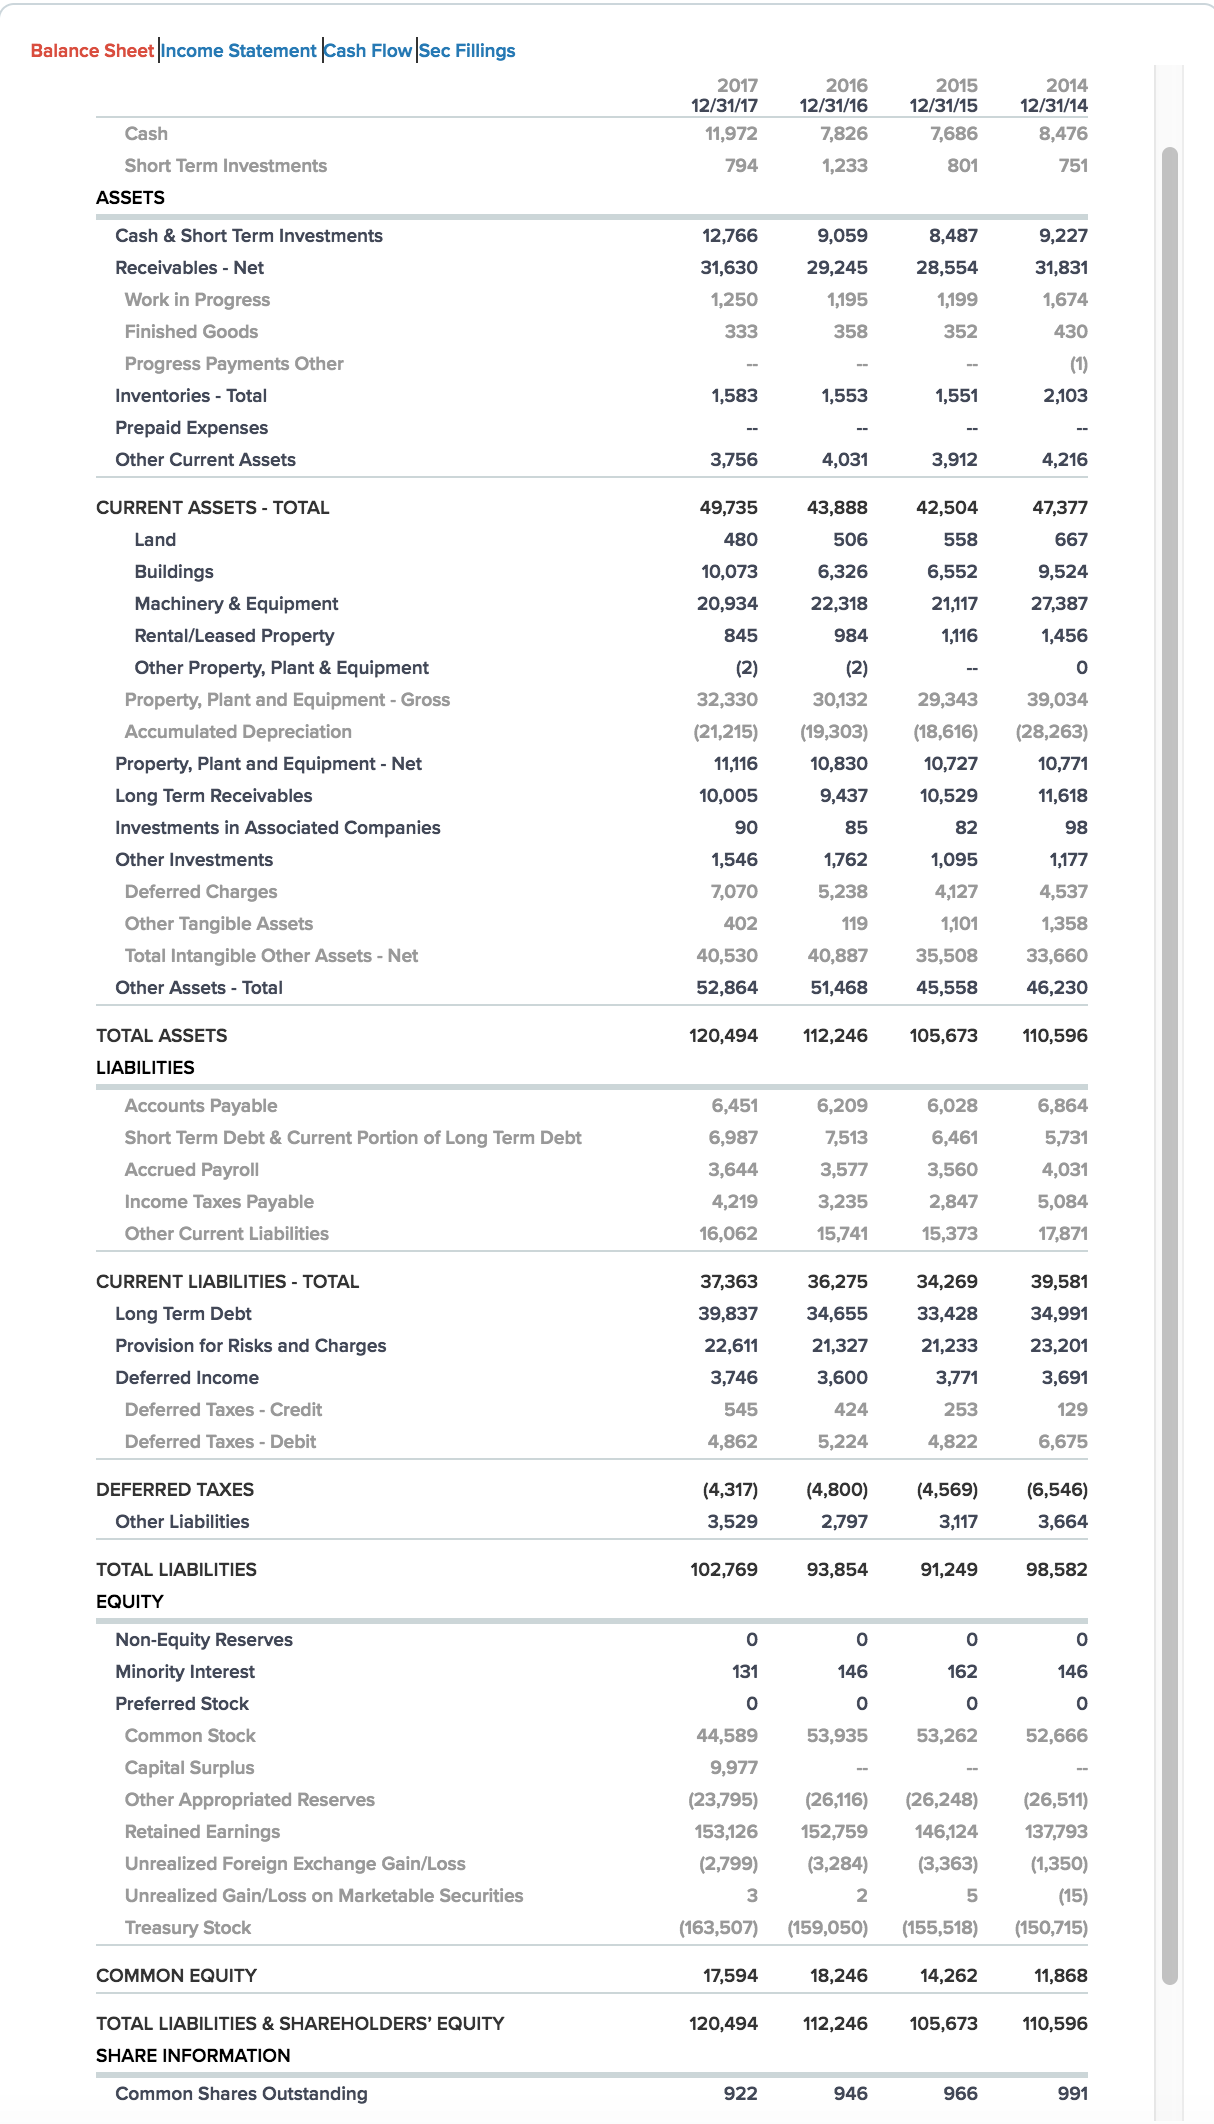
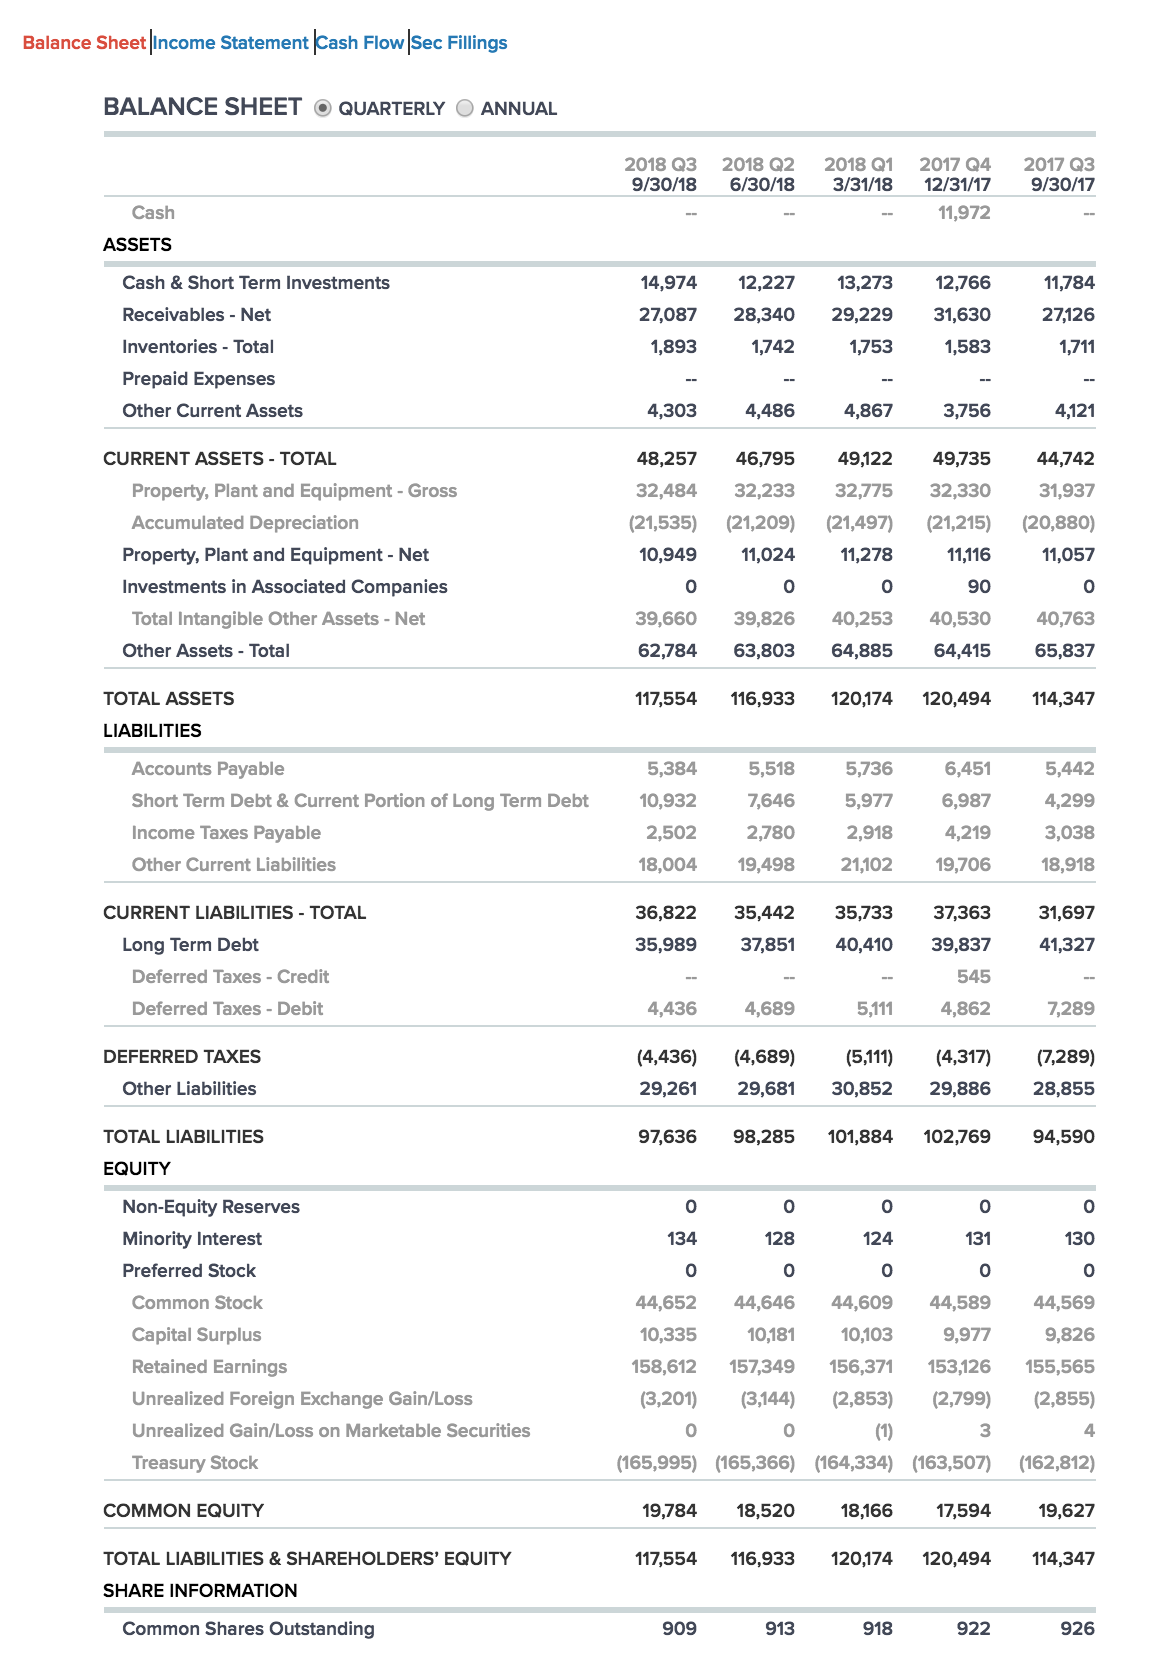
I'm calling your attention to two lines: common equity and common shares outstanding. As we can see, the common equity for IBM has been surging, while the share count has been picked over and whittled down like a plate of homemade cookies. Equity per share stood at $11.98 per share in 2014. As of September, 2018, the equity per share has leapt to $21.76. This is an excellent measure of how much the company's intrinsic value has grown over recent years. (Screenshot from CNBC.Com)
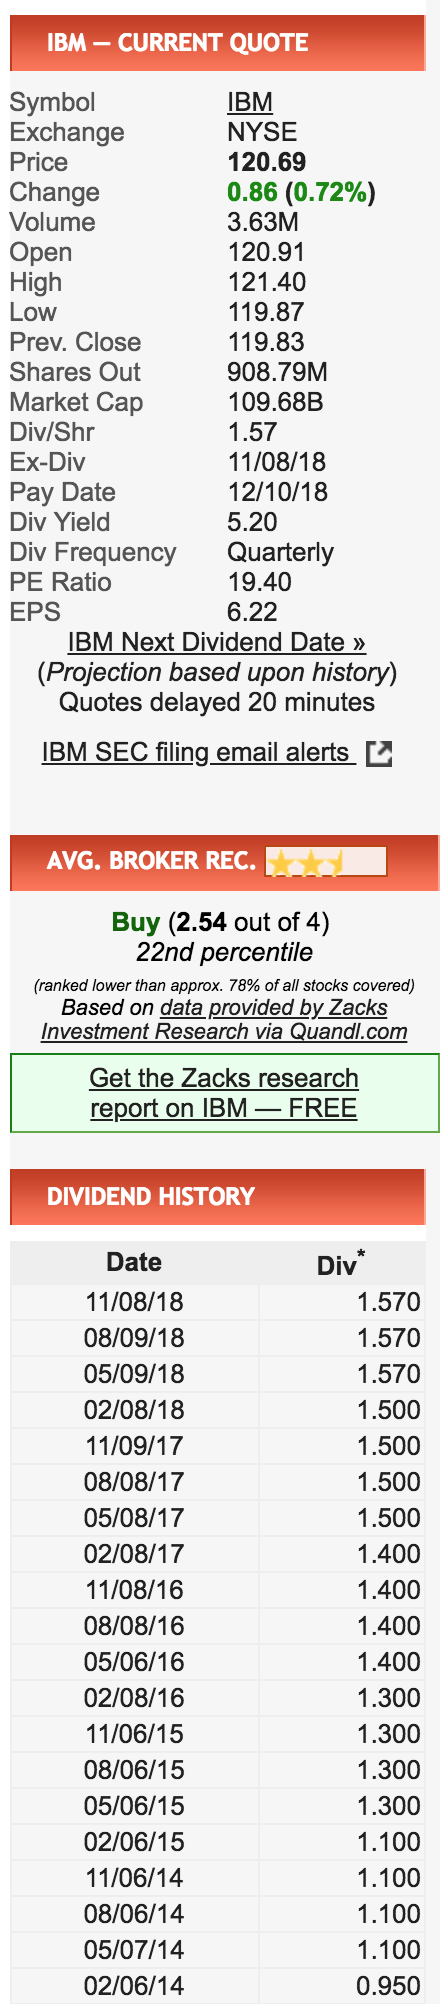
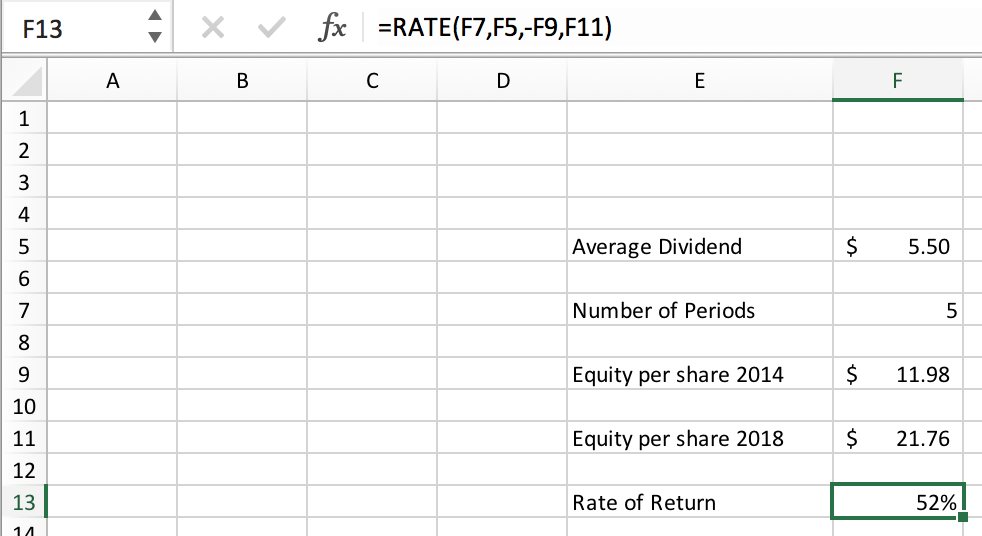
On its own, rising common equity per share is an incomplete measure of how much value the company has put into the pockets of its shareholders. During the same 5 year period, IBM paid it's shareholders an average annual dividend of $5.50 per share. (Screenshot from Dividendchannel.com)
I calculate this staggering return to shareholders at 52% per year.
Looking at the balance sheet gives you a slightly different perspective than the income statement or cash flow statement. How has IBM's strategic turnaround been going? If you just look at the cash flow, you'd conclude that progress has been slow to nonexistent - which seems to be mostly what you read about when it comes to IBM. (Screenshot from CNBC.Com)
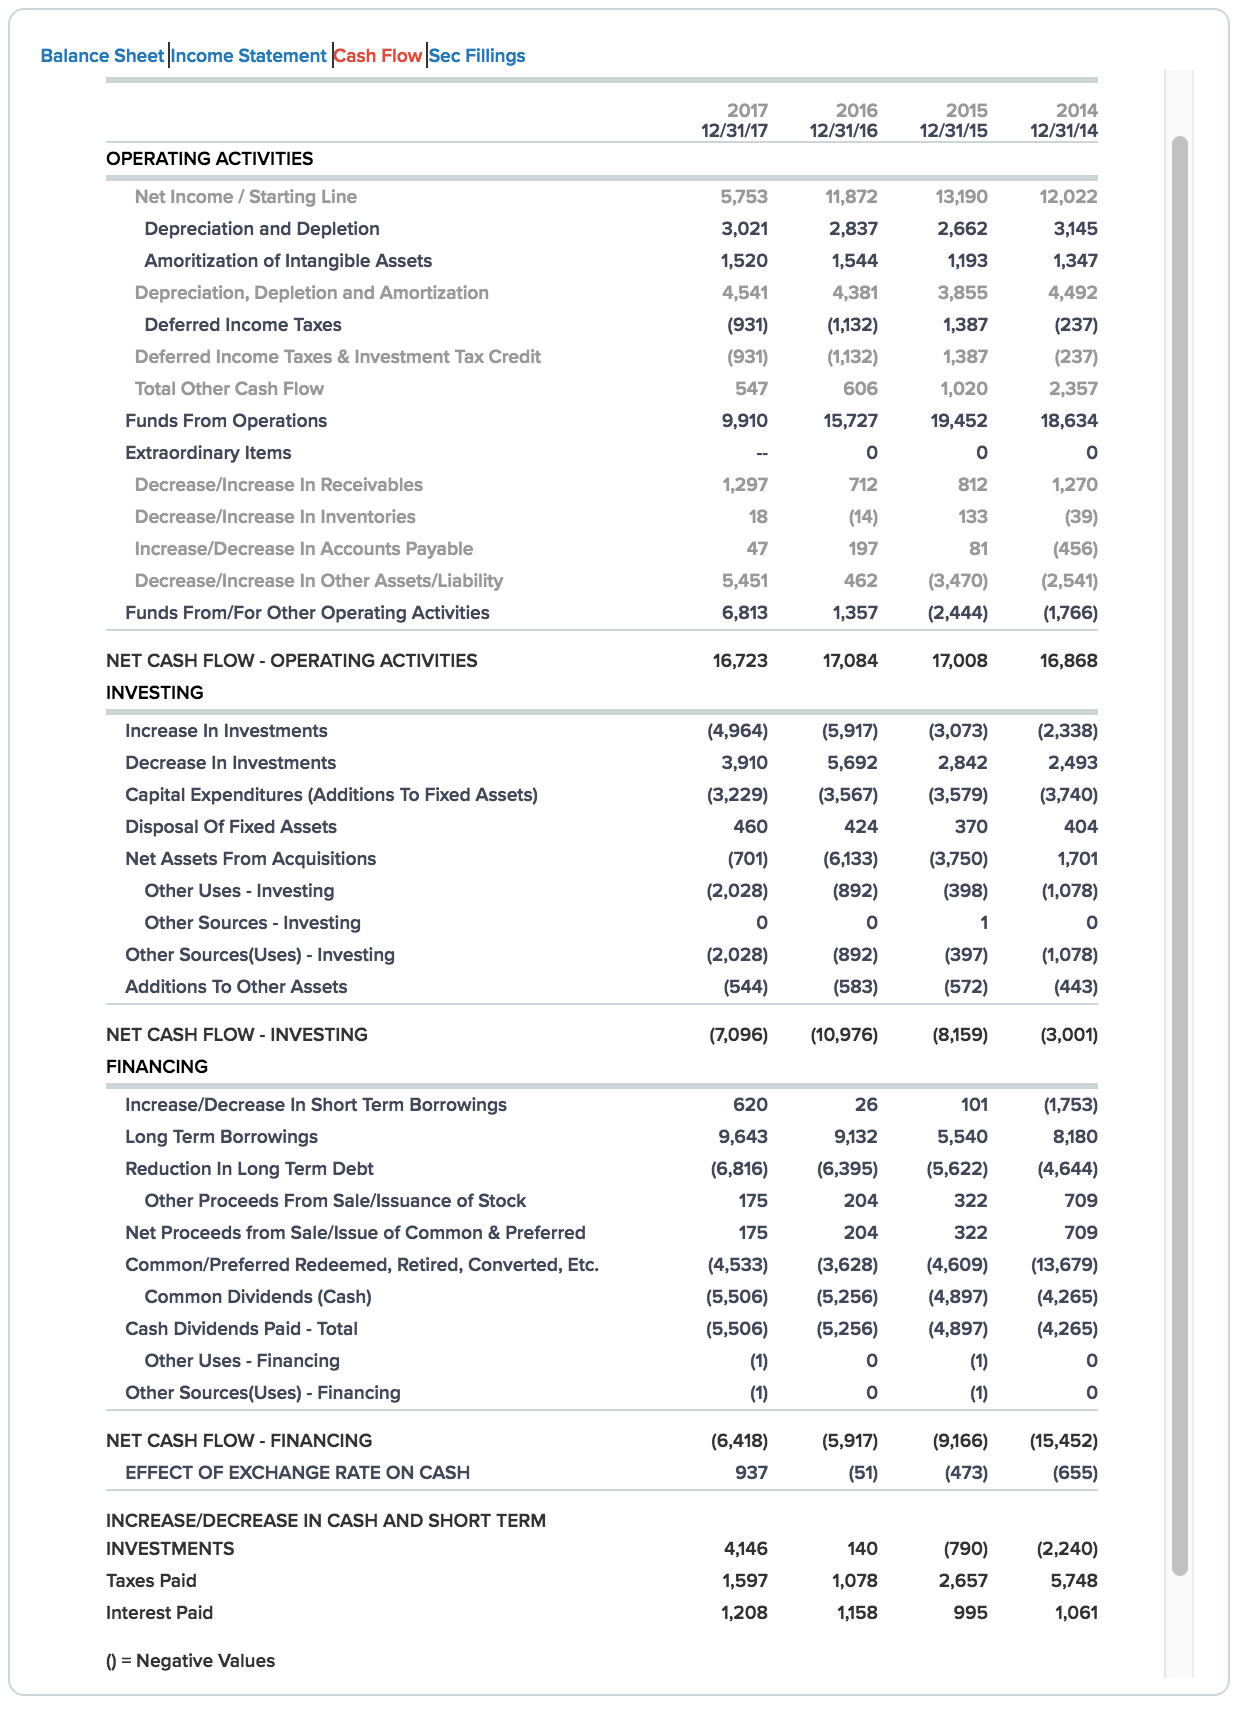
Perhaps lousy revenue and cash flow growth accounts for the malodorous share price action that shareholder have enjoyed these last few years?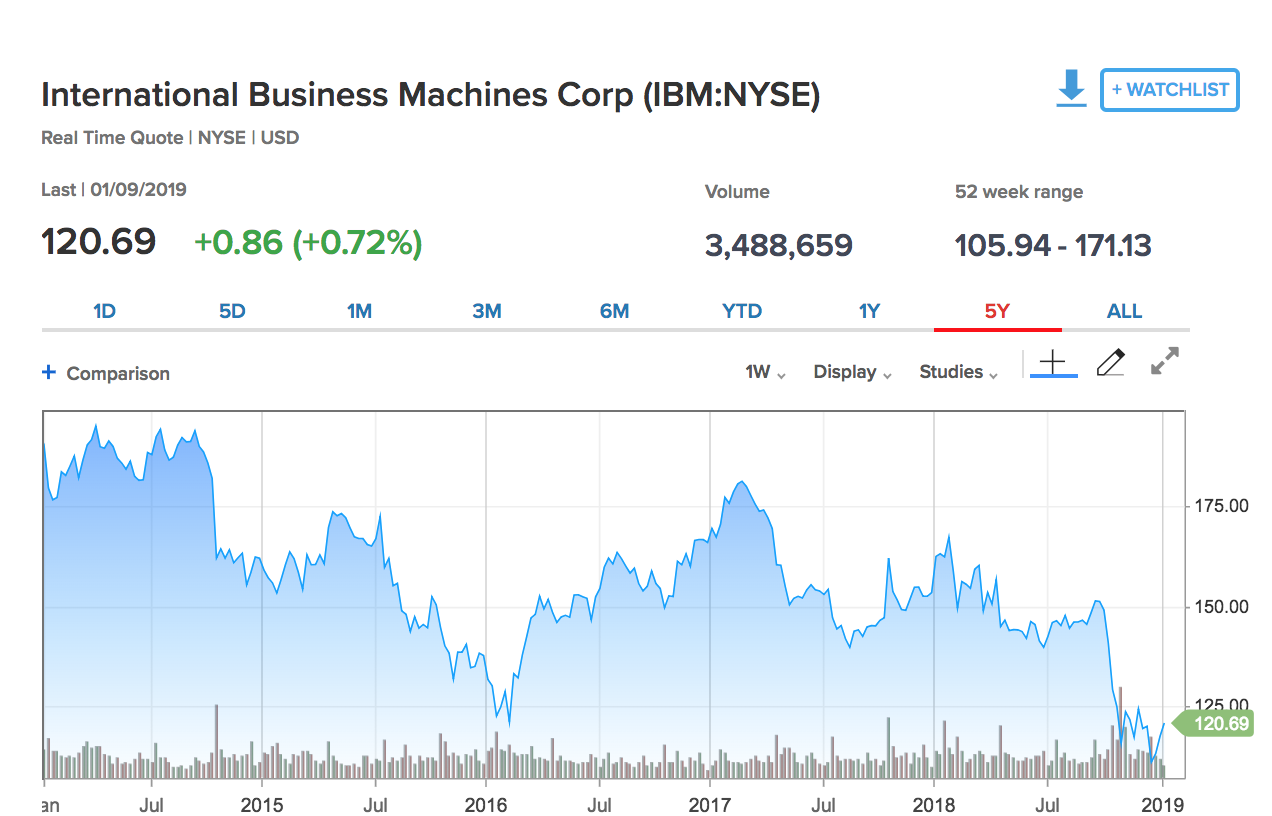
The balance sheet for IBM tells a rather different story about the financial health of the business - which appears excellent. As far as past performance goes, the key seems to have been the falling share count which has had a salutary impact on the rising equity per share and fueled dividend growth even in the face of stagnant overall corporate