The slope of the flat-ish slope of S&P 500's (SPY) 200-day moving average tells us to keep an open mind about better-than-expected outcomes in the days, weeks, and months ahead. A recent development on the breadth front also falls into that bullish-open-mind category.
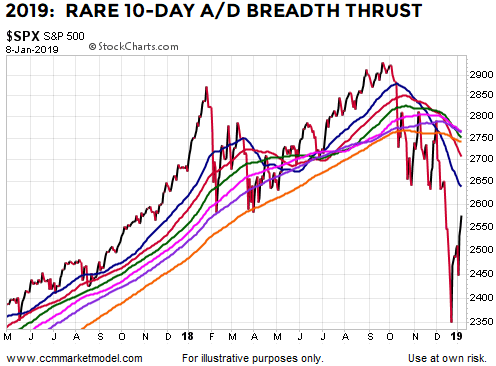
A 10-day advance/decline breadth thrust was completed on January 8, 2019. Given a similar breadth thrust has only taken place twenty-five times since 1945, it is fair to say this type of thrust is very rare. It is even more rare for the thrust to take place from a weak profile with the following distinguishing characteristics:
- Price was below all the generic moving averages we have been using in recent videos to illustrate basic concepts about trends.
- The slopes of all the moving averages were down to flat-ish (50-day to 200-day).
- The thrust occurred after a sharp vertical plunge, and thus formed a V-pattern.
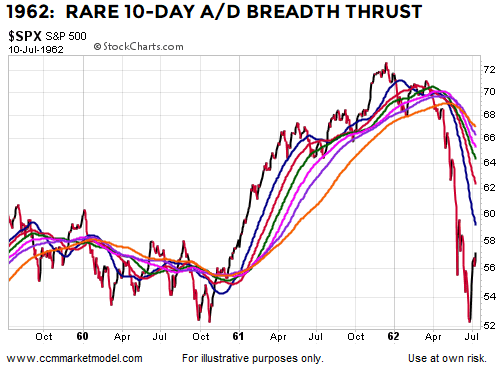
We reviewed all twenty-five previous cases and found only a handful that aligns well with the present-day market. The best fit appears to be the breadth thrust that occurred off the 1962 plunge low. Note in both the 2019 case above and the 1962 case below, the market was clearly in a downtrend.
Even if you take a very liberal "ish" type approach when making the comparisons, only four cases come close to checking all the boxes shown in the table below: 1962, 1971, 1982, and 2019. With liberal comparison standards, ten cases can check at least three of the four boxes: 1949, 1958, 1962 (2), 1971, 1982, 1991, 2009, 2016, and 2019.

Best Match: 1962
Since 1962's breadth thrust occurred after a plunge (VOO) and from a very weak technical profile, similar to 2018-2019, it might be helpful to understand what happened after the 10-day thrust that ended on July 10, 1962. Notice like