In this article, I'll discuss the two primary paths for the coming machinations in the S&P 500 Stock Index and a view of how active investors and traders position to minimize losses and maximize profits.
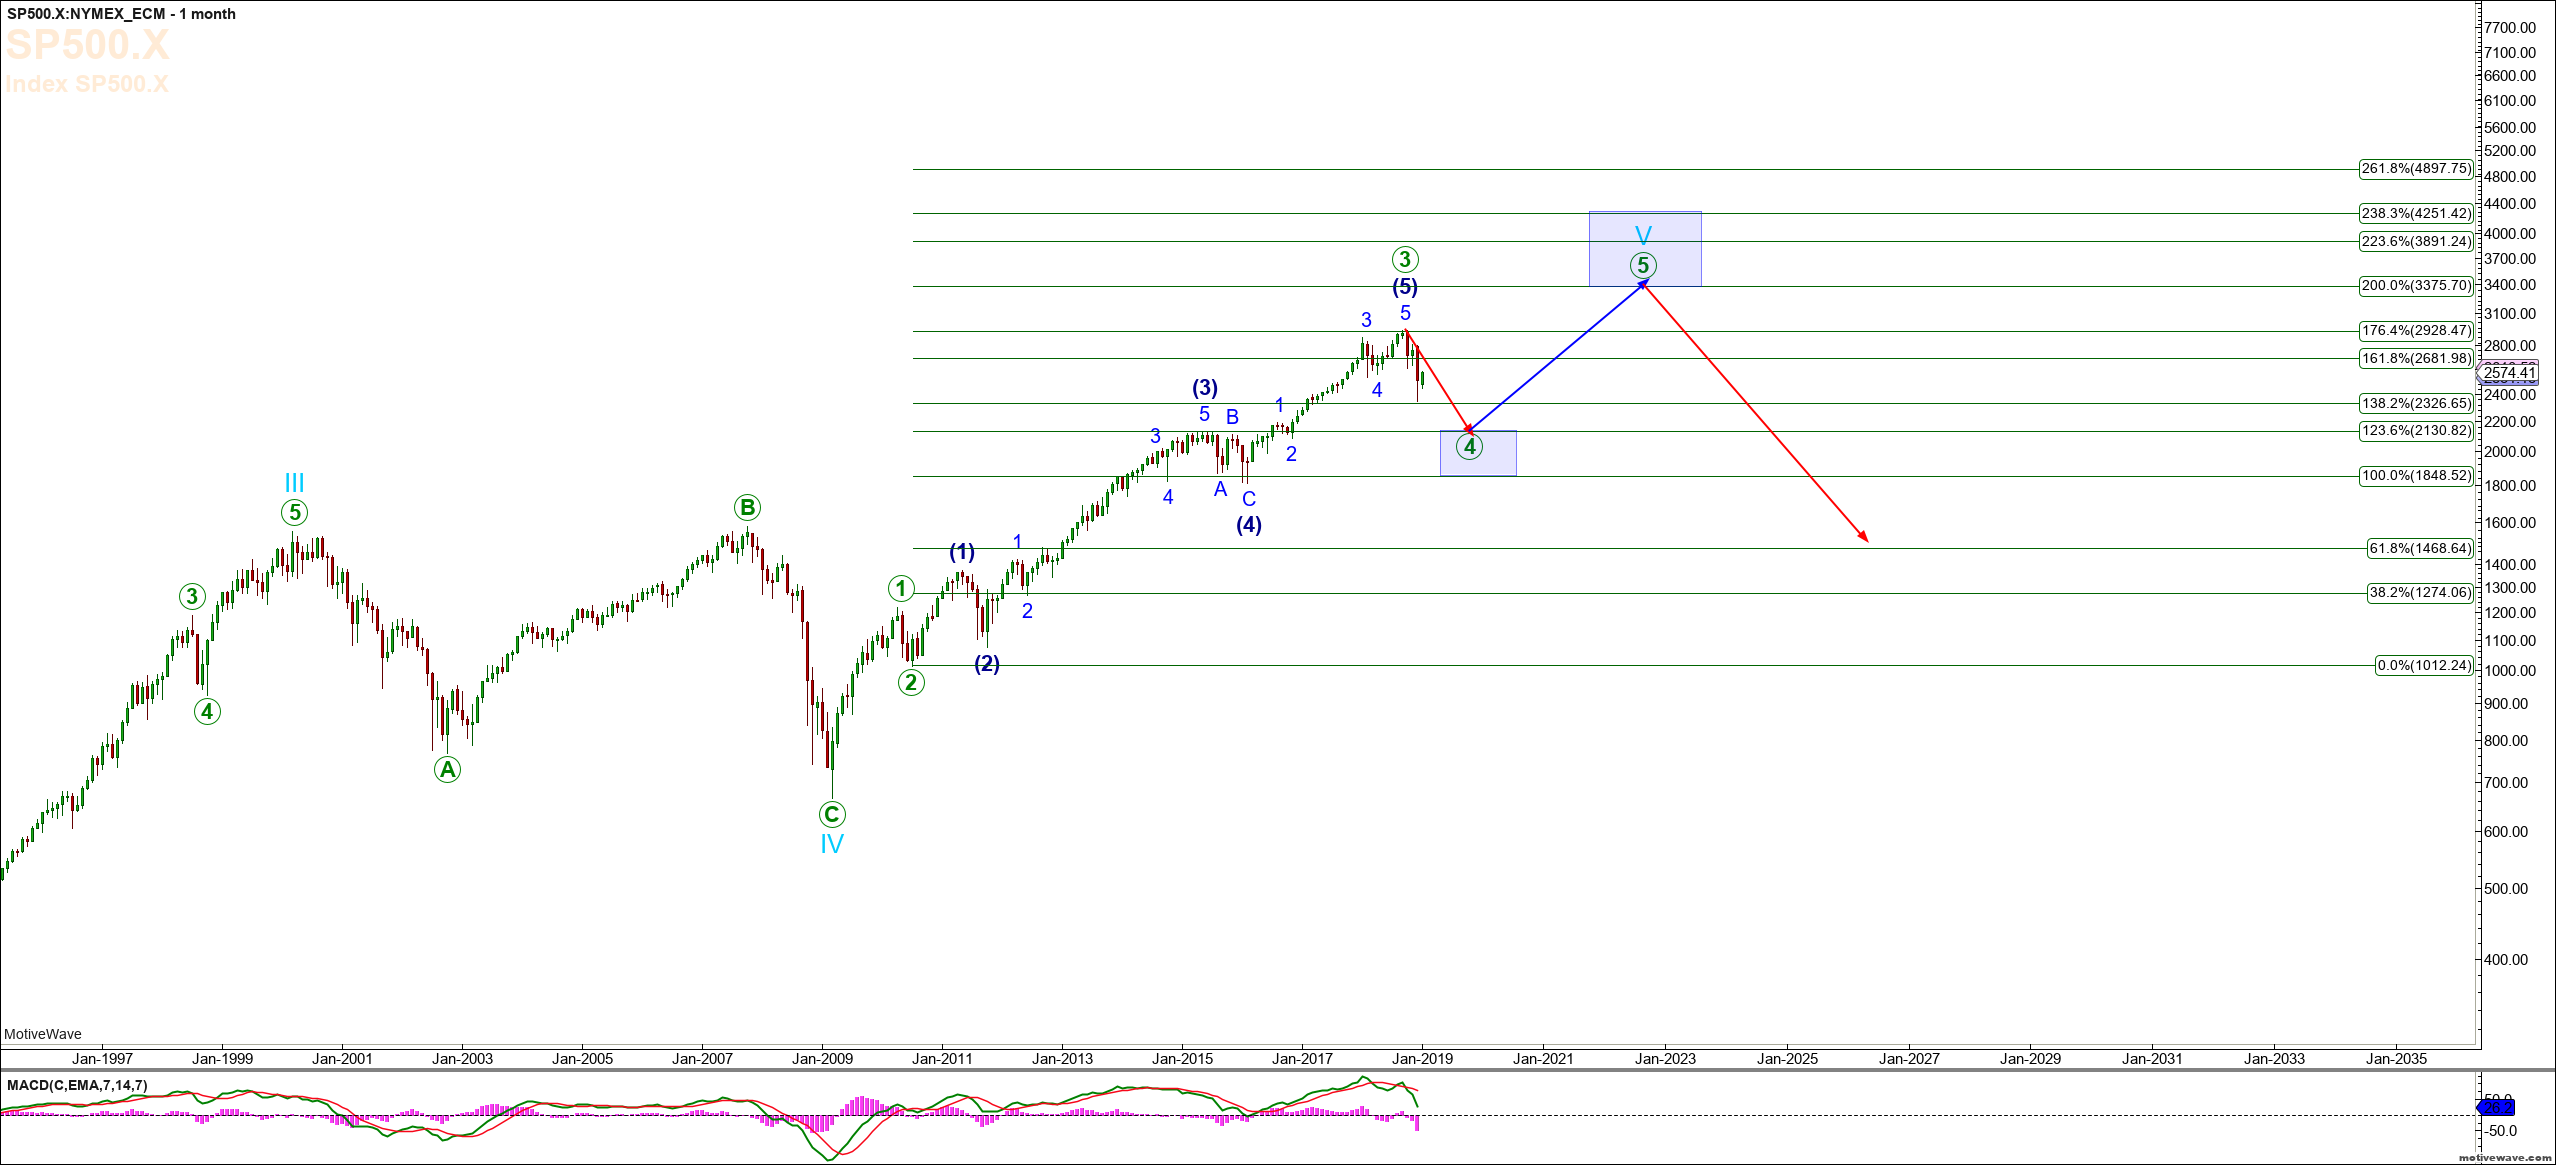
Let's start with the monthly chart showing the move up off the 2009 low (birds-eye view). What now seems clear is that the SPX has completed Primary Degree Wave 3 at the high seen on October 3, 2018, and is presently in a corrective 3-wave structure to lower levels, with our ultimate expectation for a move to the 2,245-2,094 region to complete Primary Degree Wave 4 before heading to new all-time highs.
Our immediate expectation is that so long as SPX remains over 2,570 at all times, then all of the move up - as shown on both the Daily chart and the Daily Alt. chart - will conclude in the 2,731-2,743 regions, with a possibility it concludes in the 2,697-region. For investors taking intermediate positions long in sector ETFs, or futures traders, this is an excellent place to exit long positions. Alternatively, if SPX breaks below 2,570, we'll be looking for a retracement against the move down as an opportunity to exit longs and potentially short the SPX.
Monthly S&P 500 Chart
The question then arises as to whether the move up off the pre-Christmas low is an A-wave of a much larger B, as shown on the Daily Alt. Chart, or is all of a larger X structure, as shown on the Daily chart. While the determination of which count won't be known until we're better able to observe the downside structure, what is reasonable to assume is that for a period of time the index level for both the Daily and Alt counts are setting up for lower levels. The Daily Alt count suggests a move down into the