One of the most persistent anomalies in finance is the tendency of equity prices to move in trends. High-yield bonds also have a strong (possibly stronger) tendency to trend. This effect has been studied in a variety of equity markets over long time periods, and it pretty much always works in the long run.
So, should you use trend-following in your portfolio? Let's look at the data! To test this hypothesis, I built a simple market timing model and applied it to the S&P 500, Japanese stocks, UK stocks, and high-yield credit. I didn't cherry-pick these asset classes - I chose them because they're large, popular markets.
The model dictates that when the risky asset is above its 200-day moving average, you should buy. When the risky asset is below its 200-day moving average, sell and rotate to 10-year Treasury notes (IEF). The system is rebalanced monthly. Live links to all models are below each graph so you can test for yourself.
US Stocks (SPY)
The blue line below corresponds to the simple system I built and the yellow/red line corresponds to buy-and-hold. The system won by a mile.
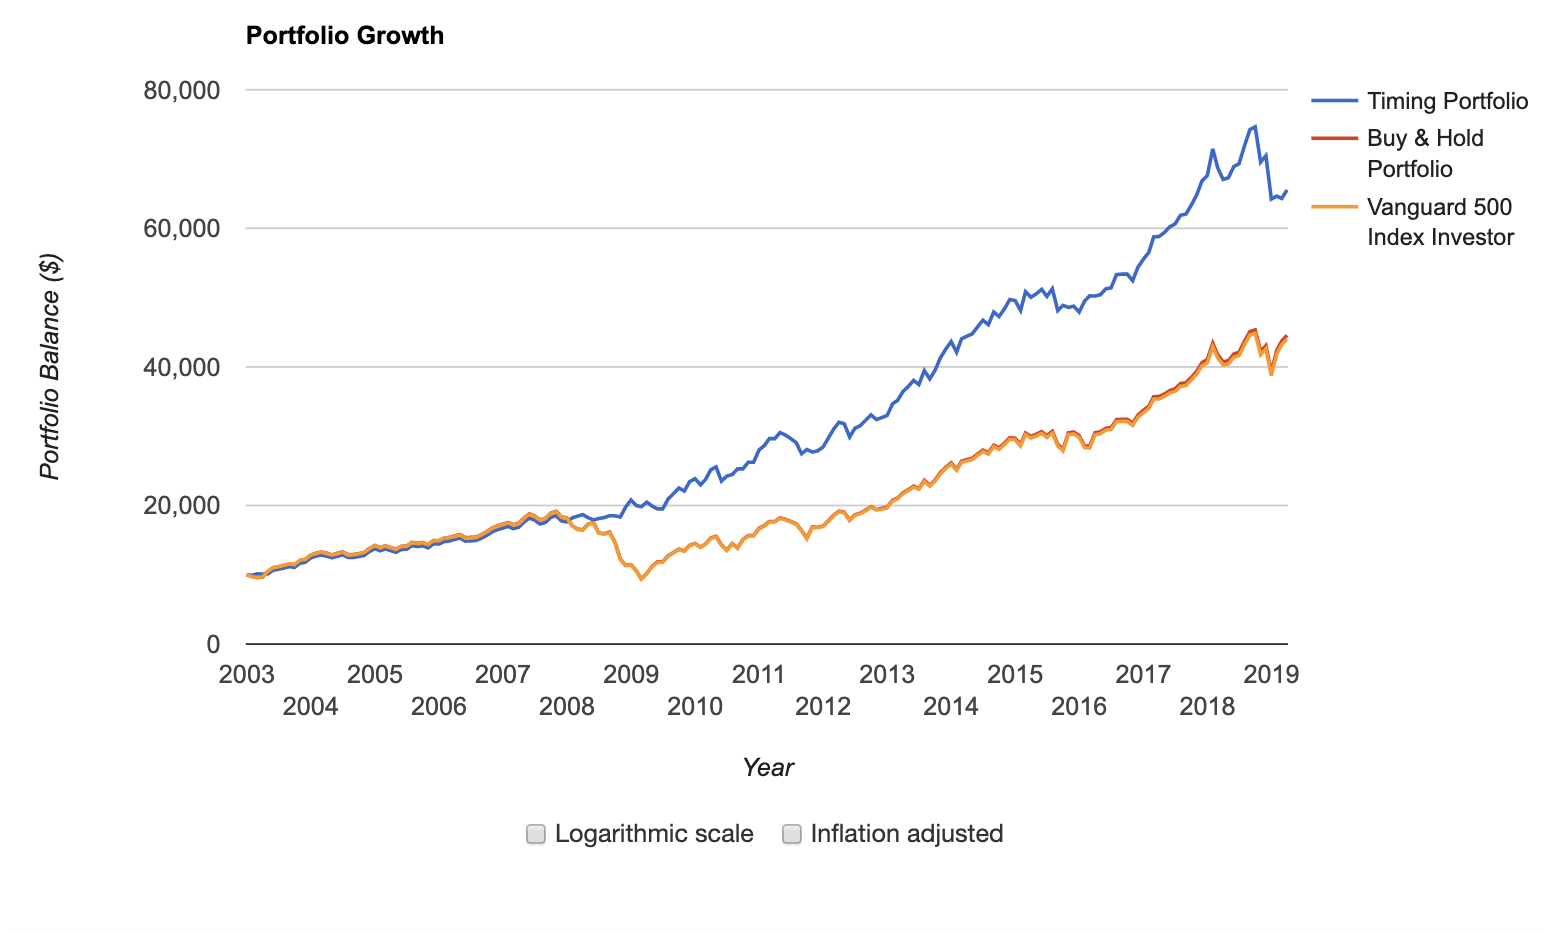
Source: Portfolio Visualizer
Trend-following in the S&P 500 using SPY or its slightly cheaper cousin IVV soundly crushes buy-and-hold going back to 2003. The results are even better if you go back to the 1990s. If you start your test after 2008, trend-following underperformed slightly but got superior risk-adjusted returns. This is important if you use leverage.
Since we've shown that market timing worked for the S&P 500 over a long time period, let's look at the stock markets of other countries to see if the hypothesis holds.
Japanese Stocks (EWJ)
A popular test for a trading system is to look at how it would have done in Japan, which has had