The Other July Small Cap Trade

Ploutos profile picture
Ploutos
20.98K Followers

Summary

  • The S&P 600 Small Cap Index has produced a meaningfully higher cumulative return than the Russell 2000 over time.
  • Part of this outperformance is a function of the mechanical mid-year rebalancing of the Russell indices.
  • Another portion of this outperformance is a "quality factor" more aptly captured by the S&P index.
  • This article shows that a S&P 600 Low Volatility index has produced even larger outperformance versus the Russell 2000 over long-time intervals, especially in the month of July.

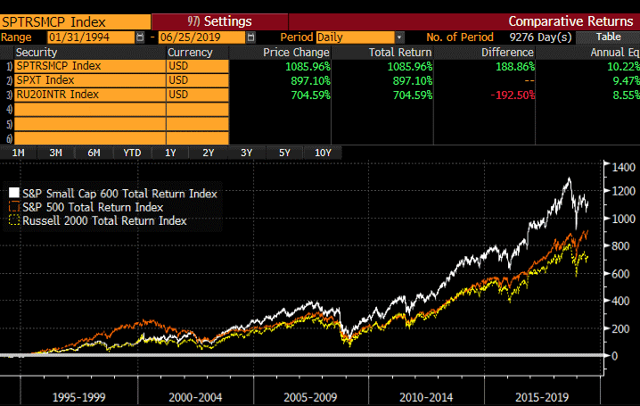
As I depicted in yesterday's article for Seeking Alpha readers, there is an anomalous trade in small-cap stocks each July. On average, S&P Small Cap 600 Index (IJR) regularly outperforms the more widely referenced Russell 2000 Index (IWM). The July monthly excess return (+60bp on average for the past 25 years) is large and statistically significant, especially for two indices that purport to capture the same market cohort.

The reason for the regular outperformance is unlikely to be arbitraged away by savvy market participants. In fact, arbitrageurs drive the performance differential. One of the reasons that the S&P 600 Small Cap Index has outperformed the more popular Russell 2000 is a simple matter of index construction.

Why does this phenomenon exist? Firms that are expected to be added to the mechanical Russell indices gain in June as investors seek to front-run index reconstitution and the forced buying by the funds that replicate the indices. These firms then lose in July and August as the added firms return to levels more reflective of their fundamentals. This drives the outperformance of the S&P 600 relative to the Russell 2000 in July and, to a lesser extent, August.

The calendar effect drives meaningful difference between the two indices, but it does not account for all of the differential. In my dataset from 1994 to now, the S&P 600 Small Cap has outperformed the Russell 2000 by 167bp per year. The 60bp average outperformance in July and 19bp outperformance in August explain nearly half the differential, but there must be something else at work.

S&P 600, Russell 2000, and S&P 500 long-run performance

Source: Bloomberg

The S&P SmallCap 600 requirement that constituents be profitable for four trailing quarters before inclusion produces the second-largest source of differentiation between the two indices. In Standard & Poor's March 2015 small-cap research piece, "A Tale of
This article was written by

Ploutos profile picture
20.98K Followers
Institutional investment manager authoring on a variety of topics that pique my interest, and could further discourse in this online community. I hold an MBA from the University of Chicago, and have earned the CFA designation. My articles may contain statements and projections that are forward-looking in nature, and therefore inherently subject to numerous risks, uncertainties and assumptions. While my articles focus on generating long-term risk-adjusted returns, investment decisions necessarily involve the risk of loss of principal. Individual investor circumstances vary significantly, and information gleaned from my articles should be applied to your own unique investment situation, objectives, risk tolerance, and investment horizon.

Analyst’s Disclosure: I am/we are long XSLV, IJR, SPY. I wrote this article myself, and it expresses my own opinions. I am not receiving compensation for it (other than from Seeking Alpha). I have no business relationship with any company whose stock is mentioned in this article.

My articles may contain statements and projections that are forward-looking in nature, and therefore inherently subject to numerous risks, uncertainties and assumptions. While my articles focus on generating long-term risk-adjusted returns, investment decisions necessarily involve the risk of loss of principal. Individual investor circumstances vary significantly, and information gleaned from my articles should be applied to your own unique investment situation, objectives, risk tolerance, and investment horizon.

Seeking Alpha's Disclosure: Past performance is no guarantee of future results. No recommendation or advice is being given as to whether any investment is suitable for a particular investor. Any views or opinions expressed above may not reflect those of Seeking Alpha as a whole. Seeking Alpha is not a licensed securities dealer, broker or US investment adviser or investment bank. Our analysts are third party authors that include both professional investors and individual investors who may not be licensed or certified by any institute or regulatory body.

Recommended For You

About XSLV ETF

SymbolLast Price% Chg
Expense Ratio
Div Frequency
Div Rate
Yield
Assets (AUM)
Compare to Peers

More on XSLV

Related Stocks

SymbolLast Price% Chg
XSLV
--