Discovery Communications Is Severely Undervalued

Mark Hake
3.28K Followers

Summary

  • Discovery Communications is moving from strength to strength as margins increase and free cash flow surges this year.
  • Our valuation of the stock's true value is $48.62, or over 53% higher than today's price.
  • A significant catalyst is the company's $1 billion stock buyback program. Expect the stock to continue to surge towards its true value.

Discovery Communications Has a True Value Which Is Much Higher Than Today's Stock Price

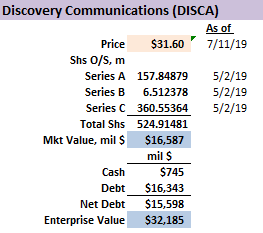
With the company's very strong Q1 2019 performance, the Discovery Communications Class A stock (DISCA) true value target price is $48.62 per share or over 53% above today's price. DISCA will continue to grow its free cash flow this year. Free cash flow was $492 million in Q1 2019, through cost and merger synergies with its Scripps Network Interactive which it has now owned for a year. A significant catalyst is the company's newly declared $1 billion share buyback program, which was announced in the company's Q1 2019 earnings results. This should push the stock to its true value. This article describes the calculation of our valuation target price.

Valuation

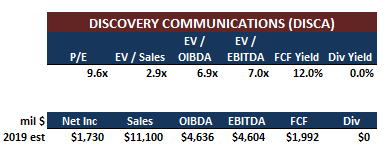
Based on the company's recent financial results, I have estimated the stock's valuation metrics on a pro forma basis for 2019:

Source: Hake estimates

Source: Hake estimate

DISCA sells for less than 10x estimated 2019 net income and 7x EV/EBITDA. More importantly for comparison purposes, its free cash flow (FCF) yield is very high at 12%. In fact, FCF yield could end up being even higher than this. For example, as of Q1 2019, management reported that the past 12 months FCF was $2.8 billion, including $300 million of cash severance and restructuring costs paid on a one-time basis. I decided to use a more conservative estimate of $2 billion, or 4x the FCF numbers achieved by DISCA during Q1 2019. As a percent of sales, the FCF margin is very high at 17.9%. As seen below, both the FCF yield and FCF margin are much higher than DISCA's peers.

Comps And True Value Calculation

The true value is calculated by comparing the value metrics with a number of peers. The average of these calculations is then

This article was written by

3.28K Followers
Mark R. Hake, CFA, has been a consultant to various companies, including hedge funds, software, and technology companies. Prior to that, Mr. Hake was President of Hake Investment Research and Hake Capital Management. He has been featured in Barron’s, CNBC, Bloomberg, and other news organizations as a contrarian investor and deep value specialist.

Analyst’s Disclosure:I/we have no positions in any stocks mentioned, and no plans to initiate any positions within the next 72 hours. I wrote this article myself, and it expresses my own opinions. I am not receiving compensation for it (other than from Seeking Alpha). I have no business relationship with any company whose stock is mentioned in this article.

Seeking Alpha's Disclosure: Past performance is no guarantee of future results. No recommendation or advice is being given as to whether any investment is suitable for a particular investor. Any views or opinions expressed above may not reflect those of Seeking Alpha as a whole. Seeking Alpha is not a licensed securities dealer, broker or US investment adviser or investment bank. Our analysts are third party authors that include both professional investors and individual investors who may not be licensed or certified by any institute or regulatory body.

Recommended For You

About WBD Stock

SymbolLast Price% Chg
Market Cap
PE
Yield
Rev Growth (YoY)
Short Interest
Prev. Close
Compare to Peers

More on WBD

Related Stocks

SymbolLast Price% Chg
WBD
--