Under Armour Post Earnings Has Its Share Of Doubters, But Cash Flow Has Improved

Brian Gilmartin, CFA
10.9K Followers

Summary

  • North American revenue is still struggling while Asia-Pacific is robust.
  • Cash flow has improved while capex is down 40% from its peak, which has driven a nice improvement in free cash flow and valuation.
  • The stock - since earnings on July 30th - is not acting well.
  • At $20 per share, Under Armour is trading at a 5% free cash flow yield.
  • Under Armour needs some apparel merchandising wins.

Looking at the earnings multiple on Under Armour (NYSE:UAA) (NYSE:UA) would give value investors a heart attack, but looking at the cash flow per share valuation leaves the stock much more appealing to valuation sensitive investors.

After Under Armour reported 2nd quarter financial results on the morning of July 30th, 2019, Telsey Advisory Group (TAG) noted that the North American revenue miss (down 3% y/y vs. the smaller miss expected) and the lack of any boost in 2019 guidance left them reiterating their $25 price target per Briefing.com.

Here is where reviewing the numbers after earnings left me thinking:

Positives:

1.) Cash flow and free cash flow continued to improve, and with the stock trading at 59x expected 2019 EPS of $0.34, it looks very expensive, but on a cash flow valuation, the stock is trading at 15x and 20x cash flow and free cash flow, respectively.

2.) While North American revenue fell low single digits for the 4th consecutive quarter, North American operating income at $139 million grew y/y for the 2nd consecutive quarter, at 5% (+8% in the March 2019 quarter).

3.) Inventory is being slashed and has fallen dramatically the last 4 quarters - here is what the history looks like:

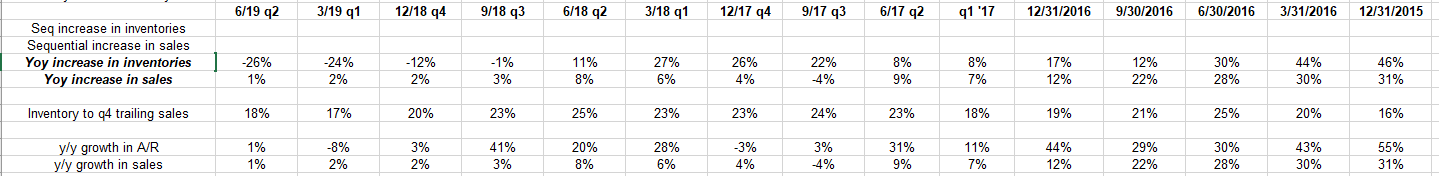
Source: modeling sheet from earnings reports

4.) Gross margin continues to improve. After bottoming at 43%-44%, here is the table history:

3.) Footwear revenue grew 5% y/y as HOVR continues to do well. Total Apparel revenue fell 1% y/y and is 62% of the Under Armour total revenue while Footwear is 24% of total revenue. Footwear's improvement is important, but Apparel improvement is more important.

Negatives:

1.) When this Under Armour earnings preview was written, the stock was up 50% YTD in 2019 but is now up just 14.25% YTD (per Morningstar data). Technically, the stock has traded back below the

This article was written by

10.9K Followers
Brian Gilmartin, is a portfolio manager at Trinity Asset Management, a firm he founded in May, 1995, catering to individual investors and institutions that werent getting the attention and service deserved, from larger firms. Brian started in the business as a fixed-income / credit analyst, with a Chicago broker-dealer, and then worked at Stein Roe & Farnham in Chicago, from 1992 - 1995, before striking out on his own and managing equity and balanced accounts for clients. Brian has a BSBA (Finance) from Xavier University, Cincinnati, Ohio, (1982) and an MBA (Finance) from Loyola University, Chicago, January, 1985. The CFA was awarded in 1994. Brian has been fortunate enough to write for the TheStreet.com from 2000 to 2012, and then the WallStreet AllStars from August 2011, to Spring, 2012. Brian also wrote for Minyanville.com, and has been quoted in numerous publications including the Wall Street Journal.

Analyst’s Disclosure:I am/we are long UAA. I wrote this article myself, and it expresses my own opinions. I am not receiving compensation for it (other than from Seeking Alpha). I have no business relationship with any company whose stock is mentioned in this article.

Seeking Alpha's Disclosure: Past performance is no guarantee of future results. No recommendation or advice is being given as to whether any investment is suitable for a particular investor. Any views or opinions expressed above may not reflect those of Seeking Alpha as a whole. Seeking Alpha is not a licensed securities dealer, broker or US investment adviser or investment bank. Our analysts are third party authors that include both professional investors and individual investors who may not be licensed or certified by any institute or regulatory body.

Recommended For You

About UAA Stock

SymbolLast Price% Chg
Market Cap
PE
Yield
Rev Growth (YoY)
Short Interest
Prev. Close
Compare to Peers

More on UAA

Related Stocks

SymbolLast Price% Chg
UAA
--
UA
--