Author's Note: This article is a very detailed analysis of Main Street Capital Corp.'s (NYSE:MAIN) dividend sustainability. I have performed this analysis due to the continued number of readers who have specifically requested such an analysis be performed on MAIN at periodic intervals. For readers who just want the summarized conclusions/results, I would suggest scrolling down to the "Conclusions Drawn" section at the bottom of the article.
Focus of Article
The focus of this article is to provide a detailed analysis with supporting documentation (via three tests) on the dividend sustainability of MAIN through June 2020. This analysis will be provided after a brief overview of MAIN's regulated investment company ("RIC") classification per the Internal Revenue Code ("IRC"). The first two tests will focus on MAIN's net investment company taxable income ("ICTI") and the company's undistributed taxable income ("UTI"). These two tests will be termed "TEST 1" and "TEST 2". The third test will focus on MAIN's unrealized appreciation on investments account and be termed "TEST 3". After these three tests, I will also include a discussion of MAIN's fairly recently announced change when it comes to the company's monthly and special periodic dividend per share rates over the next several years.
Understanding the tax and dividend payout characteristics of MAIN will provide investors with an overall better understanding of the business development company ("BDC") sector as a whole. From reading this article, investors will better understand how a RIC per the IRC comes up with the company's current dividend per share rate and specific signs when an impending increase or decrease should occur. In the past, I have covered a handful of sector peers' IRC metrics via similar articles (ultimately based on reader requests).
At the end of this article, there will be a conclusion based on the results obtained from TEST 1, TEST 2, and TEST 3 about the dividend sustainability of MAIN. I will also provide my projection regarding MAIN's monthly dividend per share rate through June 2020 and my projection regarding the company's special periodic dividend for the second half of 2019 and first half of 2020. My BUY, SELL, or HOLD recommendation and current price target for MAIN are also stated in the "Conclusions Drawn" section at the end of the article.
Discussion of MAIN's RIC Classification per the IRC
As a BDC, MAIN elects to be treated as a RIC under Subchapter M of the IRC. To continue to qualify annually as a RIC, the IRC requires MAIN to meet certain "source-of-income" and "asset diversification" requirements. These requirements are beyond the scope of this article and will not be mentioned again. There is one specific provision which pertains to MAIN's dividend sustainability that should be discussed. As a RIC, MAIN is required to distribute to shareholders at least 90% of the company's ICTI and net capital gains (in excess of any capital loss carryforward balance; if applicable) in any given tax year in order to be eligible for the tax benefits allowed in regards to this type of entity. This is a very similar taxation treatment when compared to a real estate investment trust ("REIT") entity. If MAIN qualifies to be taxed as a RIC, the company avoids double taxation by being allowed to take a dividends paid deduction at the corporate level.
Several book to tax adjustments need to be determined to properly convert MAIN's earnings per share("EPS") figure to the company's ICTI. Next, one would need to determine MAIN's net capital gains for the specified time period. Net capital gains consist of realized short-term net capital gains in excess of realized long-term net capital losses for each tax year. While some sector peers continue to have a material capital loss carryforward balance from prior years, MAIN currently is one of several BDC exceptions. In fact, MAIN has never had a capital loss carryforward balance dating all the way back to the company's initial public offering ("IPO"). This is an important (and positive) factor for readers to understand. Simply put, this provides factual evidence MAIN's management team has had a long "track record" of outperforming a vast majority of BDC peers through a disciplined approach to investing, strong managerial expertise to assist certain portfolio companies when needed, and strong underwriting skills. I believe this is one the main reasons why MAIN continues to trade at a substantial premium to most BDC peers.
When MAIN's ICTI and net capital gains are combined, this comprises the company's net ICTI which is also known as its annual distribution requirement ("ADR"). Regarding MAIN's ADR, the company has an additional option available if it fails to distribute 90% of its net ICTI within a given year. MAIN is allowed to carry over its net ICTI into the following year. However, MAIN needs to distribute the company's remaining net ICTI for a given tax year through declared dividends prior to the filing of its tax return for that applicable year. This is also known as the spillback provision which MAIN has continued to utilize. If MAIN fails to comply with this provision, excluding the one extraordinary measure that is discussed below, the company would be declassified as a RIC per the IRC. If this were to occur, all of MAIN's net ICTI would be subject to taxation at regular corporate tax rates at the company level.
As noted above, there is one extraordinary measure that could be taken by a RIC for relief of the spillback provision (which a certain BDC peer recently utilized; a "deemed" distribution) but that is a scenario I believe shareholders would strongly be against. In a nutshell, a RIC would pay corporate taxes on the retained undistributed capital gains at the BDC level while shareholders would receive a tax credit currently equal to 21% of the deemed distribution. In my professional opinion, it would make much more sense to "pass-through" the company's capital gains to shareholders via the spillback provision versus paying taxes on such gains. Since I began covering MAIN, management has continued to be in agreement with my overall sentiment on this topic (a deemed distribution is inefficient/not the wisest strategy).
MAIN's Primary Factor Regarding Setting an Appropriate Dividend Per Share Rate - Intend to Cover the Company's ADR with Net ICTI
To fully understand and accurately project a BDC's dividend sustainability, readers must understand the subtle differences between a company's net investment income ("NII") and net ICTI figures/cumulative UTI balances. As stated earlier, due to the fact MAIN continues to not have a capital loss carryforward balance, this is an extremely important concept to understand. Simply put, not having this balance continues to "de-couple" MAIN's quarterly NII and net ICTI and notably widens the gap between the company's cumulative undistributed NII and cumulative UTI balances. As such, readers/contributors not considering IRC methodologies greatly lower the probability of providing accurate projections over a prolonged period of time. Since this is such an important concept to understand, let us briefly discuss this distinction.
NII is a Generally Accepted Accounting Principles ("GAAP") figure which is based on the accrual method of accounting. ICTI and net ICTI are IRC figures which are "generally" based on the cash method of accounting (some exceptions to this notion [for instance payment-in-kind income and differing depreciation/amortization time tables] but I am keeping it simple for this discussion). Income and expense recognition of certain accounting transactions differ between GAAP and the IRC (book versus tax accounting treatments). A majority of MAIN's book to tax differences (either temporary or permanent in nature) consist of the following: 1) deferred financing fees on loans and deferred offering costs in relation to equity raises; 2) pre-tax book income (losses) related to the Internal Investment Manager; 3) share-based compensation expense; and 4) income tax (provisions) benefits. There are several additional book to tax adjustments that MAIN periodically recognizes. However, for purposes of this "free to the public" article, further discussion of these additional adjustments is unwarranted. Let us now move on to MAIN's dividend sustainability analysis.
To test MAIN's primary factor, I believe it is necessary to analyze and discuss the company's historical quarterly net ICTI figures to see if the company's quarterly dividend distributions were being covered. This will lead to a better understanding of the overall trends regarding this particular metric and possible pitfalls that may arise in the future. This includes MAIN using the company's cumulative UTI balance on any quarterly/annual net ICTI overpayments. I also believe it is desirable to analyze and discuss my projected MAIN net ICTI figures for 2019 to see if the company's projected dividend distributions will be covered.
By using this methodology, I have consistently provided highly accurate projections within the BDC sector over multiple years (including the most accurate projections on Seeking Alpha). Table 1 below shows MAIN's annual net ICTI for 2015, 2016, 2017, and 2018. Table 1 also shows my updated annual projection for 2019.
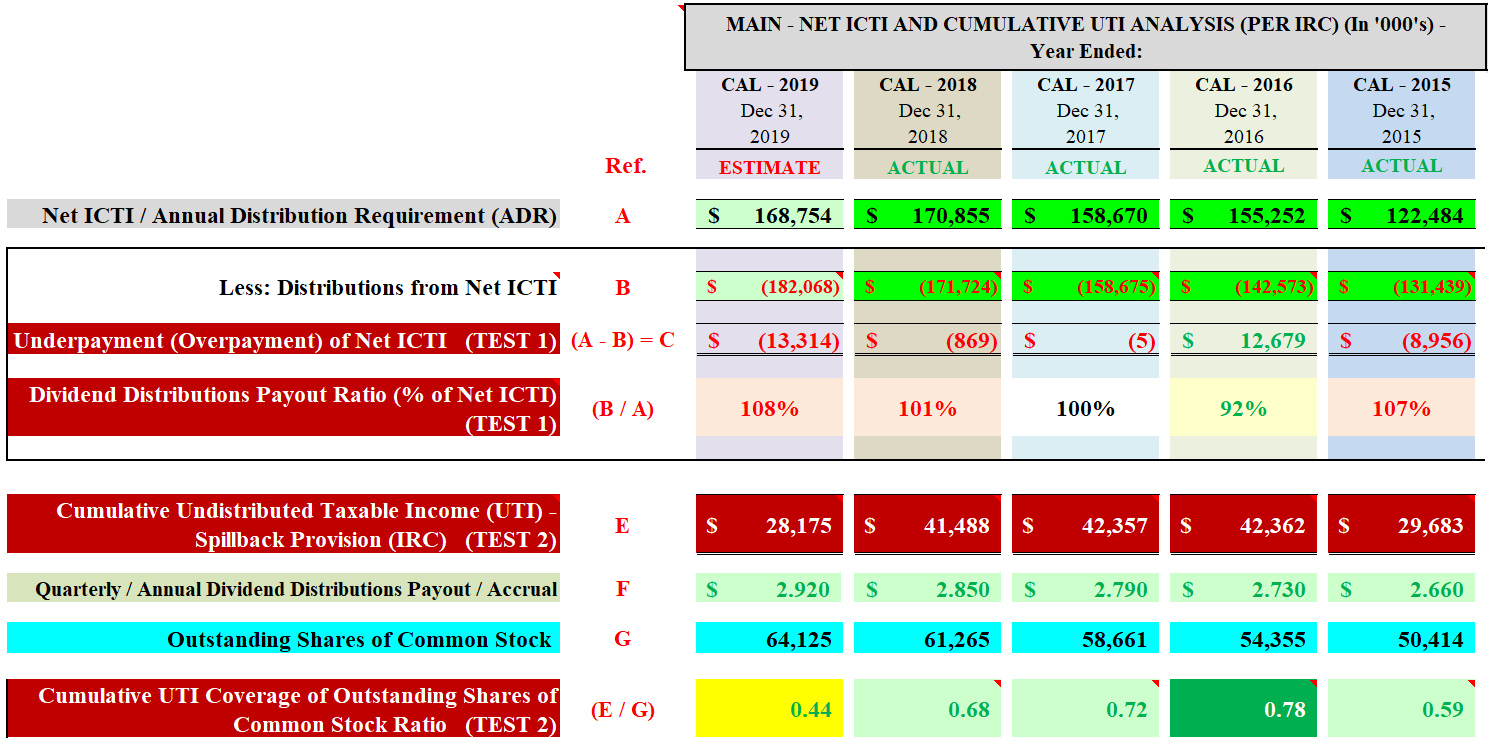
Table 1 - MAIN Net ICTI and Cumulative UTI Analysis (IRC Methodologies Based on Annual Timeframes)
 (Source: Table created by me, partially using MAIN data obtained from the SEC's EDGAR Database)
All ACTUAL figures within Table 1 above are checked and verified, either directly or through reconciliations, to various spreadsheets and data from MAIN's supporting documentation (excludes all ratios). Table 1 will be the main source of information as TEST 1 and TEST 2 are analyzed below.
TEST 1 - Quarterly Net ICTI Versus Quarterly Distributions Analysis:
- See Red References "A, B, C, (B / A)" in Table 1 Above Next to the December 31, 2019 Column
Using Table 1 above as a reference, I take MAIN's annual "net ICTI" figure (see red reference "A") and subtract this amount by the annual "distributions from net ICTI" figure (see red reference "B"). If red reference "A" is greater than red reference "B", then MAIN technically had enough annual net ICTI to pay out the company's dividend distributions for that particular period of time (both monthly and special periodic dividends when applicable). Any excess net ICTI left over, after accounting for MAIN's dividend distributions, is added to the company's cumulative UTI balance. This particular balance will be analyzed within TEST 2 later in the article. If red reference "A" is less than red reference "B", then MAIN technically did not have enough annual net ICTI to pay out the company's dividend distributions for a particular period and must use a portion of the cumulative UTI balance to help with the overpayment.
TEST 1 - Analysis and Results:
Still using Table 1 above as a reference, MAIN had annual net ICTI of $122.5, $155.3, $158.7, and $170.9 million for 2015, 2016, 2017, and 2018, respectively. In comparison, MAIN had annual dividend distributions of ($131.4), ($142.6), ($158.7), and ($171.7) million, respectively. When calculated, MAIN had an annual underpayment (overpayment) of net ICTI of ($9.0), $12.7, less than ($0.1), and ($0.9) million for 2015, 2016, 2017, and 2018, respectively (see red reference "(A - B) = C"). This calculates to an annual dividend distributions payout ratio of 107%, 92%, 100%, and 101%, respectively (see red reference "(B / A)"). When combined, MAIN had an underpayment of net ICTI of $2.9 million (rounded) during 2015-2018 which calculates to a four-year dividend distributions payout ratio of 99.5%. In my opinion, most readers would view this as MAIN basically matching the company's net ICTI to its total dividend distributions.
The slightly above average net ICTI for the first quarter of 2018 was mainly due to realized gains within Hydratec, Inc. (Hydratec) and SoftTouch Medical Holdings LLC (SoftTouch) partially offset by realized losses within Charlotte Russe, Inc. (Charlotte Russe; debt-to-equity "write-off") and GST Autoleather, Inc. (GST Autoleather). When combined, MAIN reported a net realized gain of $6.1 million during the first quarter of 2018. The modestly below average net ICTI for the second quarter of 2018 was mainly due to realized losses within Marine Shelters Holdings, LLC (Marine Shelters) and CapFusion, LLC (CapFusion). These two portfolio companies were previously written-down and this was merely an unrealized to realized loss reclassification ("cleaning up" the balance sheet). When combined, MAIN reported a net realized loss of ($15.5) million during the second quarter of 2018.
As I previously correctly projected, MAIN's net ICTI for the third quarter of 2018 had a nice "bounce back". The modestly above average net ICTI was mainly due to realized gains within Drilling Info Holdings, Inc. (Drilling) and Valley Healthcare Group, LLC (Valley Healthcare) partially offset by a realized loss within Cenveo Corporation (Cenveo; partial debt-to-equity write-off). When combined, MAIN reported a net realized gain of $9.2 million during the third quarter of 2018. MAIN also had a partial reversal regarding previously taxable income within the company's management subsidiary, Main Street Capital Adviser I, LLC (MSC Adviser I). The slightly below average net ICTI for the fourth quarter of 2018 was mainly due to realized losses within Gault Financial, LLC (Gault) and OPI International Ltd. ("OPI"). When combined, MAIN reported a net realized loss of ($1.4) million during the fourth quarter of 2018.
Let us now take a look at my projection for MAIN's net ICTI for 2019. I am currently projecting MAIN will report net ICTI of $168.8 million for 2019. In comparison, I am currently projecting MAIN will have dividend distributions of ($182.1) million. When calculated, I am currently projecting MAIN will have an overpayment of net ICTI of ($13.3) million for 2019. This calculates to an annual dividend distributions payout ratio of 108% which would be considered a modest overpayment (at or greater than 105% but less than 110% payout) of net ICTI. However, it should be noted this payout ratio includes accounting for both of MAIN's special periodic dividends for 2019. This modest overpayment takes into consideration the following recent MAIN factors that have occurred/will continue to occur over the foreseeable future: 1) recent reversal (and projected more severe reversal) of the U.S. London Interbank Offered Rate (LIBOR) and the negative impact on floating-rate debt investments (puts pressure on weighted average yields); and 2) several recent "write-offs"/capital losses which have negatively impacted net ICTI during the first half of 2019.
When looking at TEST 1 on a "standalone" basis, I believe MAIN's very minor net underpayment for 2015-2018 and projected modest overpayment of net ICTI for 2019 could be perceived as an "overly negative" trend regarding the company's dividend sustainability. I also believe this general interpretation would be a preliminary "rush to judgment". I would stress to readers this payout ratio includes ALL of MAIN's special periodic dividends that were distributed/are projected to be distributed during 2015-2019. This is important to understand. To take this dividend sustainability analysis a step further, let us now perform TEST 2.
TEST 2 - Cumulative UTI Coverage of Outstanding Shares of Common Stock Ratio Analysis:
- See Red References "E, G, (E / G)" in Table 1 Above Next to the December 31, 2019 Column
Once again using Table 1 above as a reference, I take MAIN's "cumulative UTI" figure (see red reference "E") and divide this amount by the company's "outstanding shares of common stock" figure (see red reference "G"). From this calculation, MAIN's "cumulative UTI coverage of outstanding shares of common stock ratio" is obtained (see red reference "(E / G)"). The higher this ratio is, the more positive the results regarding MAIN's future dividend sustainability. Simply put, this ratio shows the amount of cumulative UTI covering the number of outstanding shares of common stock for that specified point in time. Since MAIN has continued to gradually increase the company's investment portfolio, through borrowings and periodic "at-the-market" ("ATM") equity offerings, this ratio shows if the company has been able to increase its cumulative UTI balance by a similar proportion.
TEST 2 - Analysis and Results:
Still using Table 1 above as a reference, MAIN had a cumulative UTI balance of $29.7, $42.4, $42.4, and $41.5 million at the end of the fourth quarter of 2015, 2016, 2017, and 2018, respectively. Due to MAIN's four-year very minor underpayment of net ICTI (as discussed in TEST 1 earlier), the company's cumulative UTI balance increased from $38.6 million as of 12/31/2014 to $41.5 million as of 12/31/2018. MAIN had 50.4, 54.4, 58.7, and 61.3 million outstanding shares of common stock, respectively. When calculated, MAIN had a cumulative UTI coverage of outstanding shares of common stock ratio of 0.59, 0.78, 0.72, and 0.68 at the end of the fourth quarter of 2015, 2016, 2017, and 2018, respectively. In my opinion, MAIN's cumulative UTI balance as of 12/31/2018 was at an attractive level (especially when compared to most BDC peers). In addition, considering MAIN distributed special periodic dividends during 2015-2018 (which most BDC peers did not declare), the company continued to have an attractive cumulative UTI balance (proportionately speaking).
Let us now take a look at my projection for MAIN's cumulative UTI at the end of 2019. I am currently projecting MAIN will report cumulative UTI of $28.2 million at the end of the fourth quarter of 2019. When calculated, I am currently projecting MAIN will have a cumulative UTI coverage of outstanding shares of common stock ratio of 0.44 at the end of the fourth quarter of 2019. This includes accounting for a projected annual dividend of $2.92 per share for 2019; an increase of 2.5% when compared to 2018.
Unlike some BDC peers I currently cover who had material dividend per share reductions over the past several years, MAIN has continued to have sufficient net ICTI for the company's dividend distributions (with an attractive surplus). This includes accounting for MAIN's special periodic dividends. This is one of the main reasons why MAIN continues to trade at a notable premium to most sector peers.
The following were the 6/30/2019 cumulative UTI coverage of outstanding shares of common stock ratios for MAIN and fourteen of the BDC stocks I currently cover (very good comparison tool/metric):
1) TPG Specialty Lending (TSLX): 1.19 (0.96 as of 6/30/2018)
2) Ares Capital Corp. (ARCC): 1.06 (0.80 as of 6/30/2018)
3) Gladstone Investment Corp. (GAIN): 0.88* (0.49 as of 6/30/2018)
4) MAIN: 0.43 (0.49 as of 6/30/2018)
5) Solar Capital Ltd. (SLRC): 0.37 (0.26 as of 6/30/2018)
6) FS KKR Capital Corp. (FSK): 0.33 (0.63 as of 6/30/2018)
6) PennantPark Floating Rate Capital Ltd. (PFLT): 0.33 (0.04 as of 6/30/2018)
8) NEWTEK Business Services Corp. (NEWT): 0.25 (0.10 as of 6/30/2018)
9) Blackrock (BLK) TCP Capital Corp. (TCPC): 0.11 (0.12 as of 6/30/2018)
10) Prospect Capital Corp. (PSEC): 0.08** (0.06 as of 6/30/2018)
11) Apollo Investment Corp. (OTC:AINV): 0.06 (0.00 as of 6/30/2018)
12) Oaktree (OAK) Specialty Lending Corp. (OCSL): 0.04 (0.12 as of 6/30/2018)
13) Golub Capital BDC Inc. (GBDC): 0.03 (0.26 as of 6/30/2018)
13) Oaktree Strategic Income Corp. (OCSI): 0.03 (0.14 as of 6/30/2018)
15) Medley Capital Corp. (MCC): 0.00; No cumulative UTI (0.10 as of 6/30/2018)
* = Notable capital gain on Cambridge Sound Management, Inc. and Logo Sportswear, Inc. during the calendar fourth quarter of 2018; partially offset by ($1.52) per common share deemed distribution during the calendar first quarter of 2019
** = Based on an Internal Revenue Code ("IRC") tax year-end of August 31st (tax year 2019 began 9/1/2018)
As readers can see, some BDC peers like to be cautious when it comes to distributing out its cumulative UTI (for instance TSLX and ARCC) while some companies like to distribute most of its "built-up" cumulative UTI annually; whether it is through a special periodic typically twice a year (for instance GAIN [however recently declared an extremely large "deemed" distribution; notably lowered this metric]), at the end of the year (for instance GBDC in recent years), or through an increased dividend in the second half of the year (for instance NEWT).
In my opinion, considering TEST 2 on a standalone basis, the evidence provided above helps support MAIN's steady-slightly increasing monthly dividend per share rate over the past several years and over the foreseeable future. TEST 2 also supports MAIN's special periodic dividends that were/are projected to be distributed from 2015-2019.
However, I do believe a bit of "caution" should also be provided to readers since my projected MAIN cumulative UTI coverage of outstanding shares of common stock ratio at the end of calendar year 2019 would be at its lowest amount since the end of calendar year 2011 (eight years). As such, I believe it would be prudent/wise for MAIN to either "monetize" a larger portfolio company or several smaller portfolio companies in late 2019-early 2020 where investment appreciation has occurred. This would directly lead to net capital gains which would directly increase net ICTI and help "bolster" future dividend distributions. This is a very good segue in transitioning to a more "forward-looking" sustainability analysis regarding MAIN's special periodic dividend.
TEST 3 - Cumulative Unrealized Appreciation Coverage of Outstanding Shares of Common Stock Ratio Analysis:
- See Red References "H, I, J, G, (J / G)" in Table 2 Below Next to the December 31, 2019 Column
To begin TEST 3, let us first take a look at the information provided in Table 2 below.
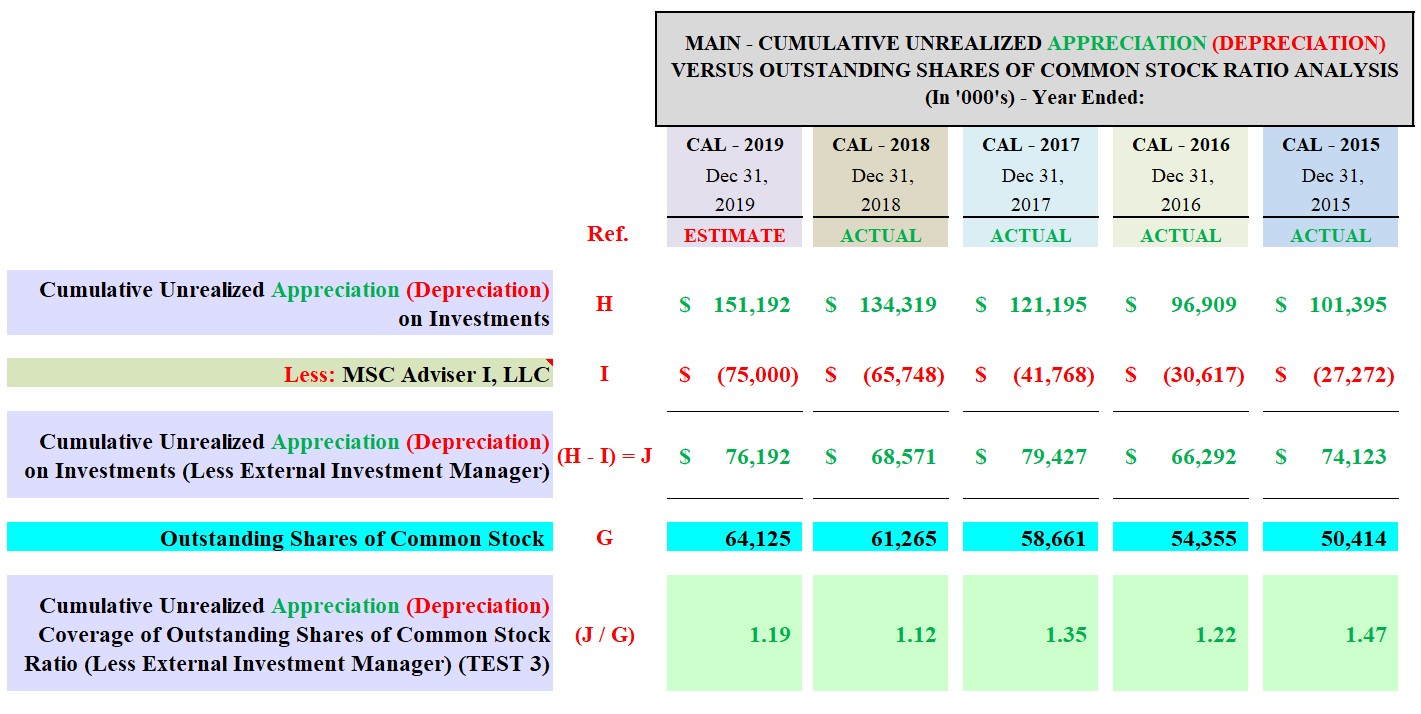
Table 2 - MAIN Cumulative Unrealized Appreciation Coverage of Outstanding Shares of Common Stock Ratio Analysis (Based on Annual Timeframes)
 (Source: Table created by me, partially using MAIN data obtained from the SEC's EDGAR Database [link provided below Table 1])
Using Table 2 above as a reference, I take MAIN's "cumulative unrealized appreciation on investments" figure (see red reference "H") and subtract from this amount the cumulative unrealized appreciation in regards to MAIN's external investment manager, MSC Adviser I (see red reference "I"). This calculated amount is MAIN's "cumulative unrealized appreciation on investments (less external investment manager)" figure (see red reference "(H - I) =J").
MSC Adviser I was formed in November 2013 as a wholly-owned subsidiary of MAIN to provide investment management and other advisory services to external parties. For rendering these services, MSC Adviser I receives fee income from a private BDC. Readers should not confuse this specific portfolio company with the fact that MAIN is internally managed. In my professional opinion, it is currently a very low probability MSC Adviser I will have a realized/capital gain in the near future due to the underlying nature of this wholly-owned subsidiary (sub-advisory services). As such, for a more accurate projection of MAIN's future special periodic dividends, I exclude the cumulative unrealized appreciation from this specific portfolio company.
Table 2 then divides this amount by the company's "outstanding shares of common stock" figure (see red reference "G"). From this calculation, MAIN's "cumulative unrealized appreciation coverage of outstanding shares of common stock ratio (less external investment manager)" is obtained (see red reference "(J / G)"). The higher this ratio is, the more positive the results regarding MAIN continuing to declare future special periodic dividends. Basically, this ratio shows the amount of cumulative unrealized appreciation covering the number of outstanding shares of common stock for a specified point in time. Since MAIN has continued to gradually increase the company's investment portfolio, through borrowings and periodic ATM equity offerings, this ratio shows if the company has been able to/will be able to increase its cumulative unrealized appreciation balance by a similar proportion.
I believe this is a good test to perform because MAIN's unrealized investment appreciation (depreciation) will eventually become a realized event. However, one unknown variable is time. It cannot be determined if MAIN will realize a particular investment gain (loss) during the next quarter, next year, or further out on the time horizon. However, it is a general "rule of thumb" that the larger a company's cumulative unrealized appreciation balance becomes, the greater the probability of realized gains occurring at some point in the future. In the end, management has the ultimate decision when to realize/monetize certain investments within MAIN's portfolio. As such, I believe TEST 3 is a good indicator of possible future realized gains which directly leads to MAIN being able to continue to pay special periodic dividends (forward-looking metric).
TEST 3 - Analysis and Results:
Still using Table 2 above as a reference, MAIN had a cumulative unrealized appreciation balance of $101.4, $96.9, $121.2, and $134.3 million at the end of the fourth quarter of 2015, 2016, 2017, and 2018, respectively. After backing out the cumulative unrealized appreciation attributable to MSC Adviser I, MAIN had a cumulative unrealized appreciation balance of $74.1, $66.3, $79.4, and $68.6 million, respectively. MAIN had 50.4, 54.4, 58.7, and 61.3 million outstanding shares of common stock at the end of the fourth quarter of 2015, 2016, 2017, and 2018, respectively. When calculated, MAIN had a cumulative unrealized appreciation coverage of outstanding shares of common stock ratio (less MSC Adviser I) of 1.47, 1.22, 1.35, and 1.12 at the end of the fourth quarter of 2015, 2016, 2017, and 2018, respectively. Even though MAIN's ratio modestly net decreased during 2015-2018, this ratio was still at a very attractive level as of 12/31/2018 (especially when compared to most sector peers who had deficit balances).
Moving to 2019, I am currently projecting MAIN will have a cumulative unrealized appreciation balance of $151.2 at the end of the fourth quarter of 2019. After backing out the cumulative unrealized appreciation attributable to MSC Adviser I, I am currently projecting MAIN will have a cumulative unrealized appreciation balance of $76.2 million. This calculates to a cumulative unrealized appreciation coverage of outstanding shares of common stock ratio (less MSC Adviser I) of 1.19. I believe this projected ratio will remain at an attractive level. This ratio also "alleviates" some of the concerns regarding MAIN's decreased cumulative UTI ratio discussed within TEST 2 earlier.
This attractive ratio is mainly due to unrealized equity gains within most of MAIN's investment portfolio. This is directly related to the recent passage of the Tax Cuts and Jobs Act ("TCJA") and continued strong operating performance by most portfolio companies. Most of MAIN's underlying portfolio companies have recently experienced a reduced effective tax rate (or pass-through rate; dependent upon entity status) regarding their "earnings and profit" (E&P) statement (an IRC methodology) due to the recent passage of the TCJA. This positively impacts MAIN's equity investments within these applicable portfolio companies (lower taxes typically equate to higher enterprise value [EV]).
Brief Discussion Regarding the Transition of MAIN's Special Periodic Dividend Into its Monthly Dividend
During MAIN's prepared remarks during the company's earnings conference call for the third quarter of 2018, management stated there will be a change, over the period of approximately five years, regarding the amount of its monthly and special periodic dividends. Over this period, there will be a gradual reduction in MAIN's special period dividend per share rate and a gradual increase in the company's monthly dividend per share rate. This change is in addition to MAIN's minor annual dividend per share rate increase which is provided through the company's monthly dividend (recently, each year has calculated to a monthly $0.005 per share increase).
As such, by the end of an approximate five-year period (likely at the end of 2024), when excluding MAIN's gradual annual dividend rate increase through monthly dividends, management has implied the company's monthly dividend would be approximately $0.245-$0.255 per share while its special period dividend would cease to exist. When including MAIN's gradual annual dividend rate increase through monthly dividends, management has implied the company's monthly dividend would be approximately $0.27-$0.28 per share while its special periodic dividend would cease to exist. As such, I believe these projections will be the "benchmark" going forward.
This will almost certainly be confusing for some market participants which is why I believe it is more prudent than ever to continue to monitor MAIN's dividend/dividend sustainability metrics. In my professional opinion, this does not indicate any notable change in overall projected results, payouts, or operational strategies. Simply put, this transition gradually "smoothes out" MAIN's payouts and allocates a minor-modest portion of future monthly dividend distributions to capital gains treatment per IRC methodologies. I will continue to "guide" readers as time passes. Since 2013, when I began writing articles here at Seeking Alpha, I have always stated IRC/net ICTI metrics, especially when it comes to MAIN, "trump" GAAP/NII metrics when discussing/projecting the company's dividend sustainability. MAIN's recently announced transition, regarding the company's dividend structure, only solidifies this notion.
I believe my coverage of this stock, in particular the extensive coverage/discussion of IRC metrics, has helped provide confidence to the MAIN management team to perform such a transition. MAIN has already put this plan "into motion" when the company's Board of Directors ("BoD") increased its monthly dividend from $0.195 per common share for February 2019 to $0.20 and $0.205 per common share which began in March and June 2019, respectively. MAIN also decreased the company's special periodic dividend from $0.275 per common share for the second half of 2018 to $0.25 per common share for the first half of 2019. These changes were exactly at the mean of my previously projected ranges.
Conclusions Drawn
To sum up the information in this article, three dividend sustainability tests were performed on MAIN. The first two tests were based on MAIN's net ICTI and cumulative UTI which are based on IRC methodologies. TEST 1 provided the following information in regards to MAIN's net ICTI payout ratio for 2015, 2016, 2017, 2018, and my projection for 2019, respectively:
MAIN's 2015, 2016, 2017, and 2018 Net ICTI Payout Ratio: 107%, 92%, 100%, and 101%
My Projected MAIN 2019 Net ICTI Payout Ratio: 108%
When looking at TEST 1 on a standalone basis, I believe MAIN's very minor net ICTI net underpayment for 2015-2018 and projected modest overpayment for 2019 could be perceived as an overly negative trend regarding the company's dividend sustainability. I also believe this general interpretation would be a preliminary rush to judgment. I would stress to readers this payout ratio includes ALL of MAIN's special periodic dividends that were distributed/are projected to be distributed during 2015-2019. This is important to understand.
To gain further clarity, TEST 2 was then performed which analyzed MAIN's cumulative UTI balance. TEST 2 provided the following information in regards to MAIN's cumulative UTI coverage of outstanding shares of common stock ratio at the end of 2015, 2016, 2017, 2018, and my projection at the end of 2019, respectively:
MAIN's Cumulative UTI Coverage of Outstanding Shares of Common Stock Ratio as of 12/31/2015, 12/31/2016, 12/31/2017, and 12/31/2018: 0.59, 0.78, 0.72, and 0.68
My Projected MAIN Cumulative UTI Coverage of Outstanding Shares of Common Stock Ratio as of 12/31/2019: 0.44
In my opinion, considering TEST 2 on a standalone basis, the evidence provided above helps support MAIN's steady-slightly increasing monthly dividend per share rate over the past several years and over the foreseeable future. TEST 2 also supports MAIN's special periodic dividends that were/are projected to be distributed from 2015-2019. However, I do believe a bit of caution should also be provided to readers since my projected MAIN cumulative UTI coverage of outstanding shares of common stock ratio at the end of calendar year 2019 would be at its lowest amount since the end of calendar year 20111 (eight years). This is just something to be mindful of heading in 2020.
As such, I believe it would be prudent/wise for MAIN to either monetize a larger portfolio company or several smaller portfolio companies in late 2019-early 2020 where investment appreciation has occurred. This would directly lead to net capital gains which would directly increase net ICTI and help bolster future dividend distributions. When looking at the results from TEST 1 and TEST 2, I have concluded the probability of MAIN being able to maintain-slightly increase the company's monthly dividend per share rate in its next several sets of dividend declarations is high (80%). As such, I am projecting MAIN will declare the following monthly dividends:
Dividend for December 2019 (Paid in January 2020) Through February 2020 (Paid in March 2020): $0.205-$0.215 per share (mean = $0.21 per share)
Dividend for March 2020 (Paid in April 2020) Through May 2020 (Paid in June 2020): $0.21-$0.22 per share (mean = $0.215 per share)
Next, TEST 3 provided the following information in regards to MAIN's cumulative unrealized appreciation coverage of outstanding shares of common stock ratio (less MSC Adviser I) at the end of 2015, 2016, 2017, 2018, and my projection at the end of 2019, respectively:
MAIN's Cumulative Unrealized Appreciation Coverage of Outstanding Shares of Common Stock Ratio (Less External Investment Manager) as of 12/31/2015, 12/31/2016, 12/31/2017, and 12/31/2018: 1.47, 1.22, 1.35, and 1.12
My Projected MAIN Cumulative UTI Coverage of Outstanding Shares of Common Stock Ratio as of 12/31/2019: 1.19
When looking at the results from TEST 2 and TEST 3, I have concluded the probability of MAIN being able to declare a semi-annual special periodic dividend through at least the first half of 2020 remains high (80%). As such, I am projecting MAIN will declare the following special periodic dividends:
Special Periodic Dividend for the Second Half of 2019 (Likely to Be Distributed December 2019): $0.20-$0.25 per share (mean = $0.225 per share)
Special Periodic Dividend for the First Half of 2020 (Likely to Be Distributed June 2020): $0.175-$0.225 per share (mean = $0.20 per share)
MAIN continues to have one of the most attractive cumulative unrealized appreciation balances in the sector, even with the slight-modest net decrease to this specific balance over the prior several years. A prior BDC comparison article I wrote provided some recent, more generalized dividend sustainability metrics regarding fifteen BDC peers that I cover (including MAIN). For additional analysis related to this topic, I refer readers to the following article:
Ares Capital's NAV, Dividend, And Valuation Versus 14 BDC Peers - Part 2 (Post Q1 2019 Earnings)
My BUY, SELL, or HOLD Recommendation:
From the analysis provided above, including additional factors not discussed within this article, I currently rate MAIN as a SELL when the company's stock price is trading at or greater than a 72.5% premium to the mean of MAIN's projected NAV as of 9/30/2019 range ($24.45 per share), a HOLD when trading at greater than a 52.5% but less than a 72.5% premium to the mean of MAIN's projected NAV as of 9/30/2019 range, and a BUY when trading at or less than a 52.5% premium to the mean of MAIN's projected NAV as of 9/30/2019 range. These ranges are unchanged when compared to my last MAIN article (approximately one month ago).
Therefore, I currently rate MAIN as a SELL (however very close to my HOLD range). As such, I currently believe MAIN is slightly overvalued. My current price target for MAIN is approximately $42.20 per share. This is currently the price where my recommendation would change to a HOLD. This is a $0.50 per share increase when compared to my last MAIN article. The current price where my recommendation would change to a BUY is approximately $37.30 per share. This is a $0.45 per share increase when compared to my last MAIN article. Long-term holders of MAIN should gain comfort that I continue to believe MAIN's dividend and NAV sustainability is currently high.
Final Note: Each investor's BUY, SELL, or HOLD decision is based on one's risk tolerance, time horizon, and dividend income goals. My personal recommendation will not fit each reader's current investing strategy. The factual information provided within this article is intended to help assist readers when it comes to investing strategies/decisions.
Recent/Current BDC Sector Stock Disclosures:
On 2/2/2018, I re-entered a position in MAIN at a weighted average purchase price of $37.425 per share. On 2/5/2018, 3/1/2018, 10/4/2018, 10/23/2018, 12/18/2018, and 12/21/2018, I increased my position in MAIN at a weighted average purchase price of $35.345, $35.365, $37.645, $36.674, $35.305, and $33.045 per share, respectively. When combined, my MAIN position had a weighted average purchase price of $34.713 per share. This weighted average per share price excluded all dividends received/reinvested. On 7/12/2019, 7/15/2019, and 7/16/2019, I sold 33%, 26%, and 41% of my position in MAIN at a weighted average sales price of $42.23, $42.605, and $42.681 per share as my current price target, at the time, of $42.20 per share was met. When calculated, this combined sale had a weighted average total return of 31% in a little over a year. Each MAIN trade was disclosed to readers in real time (that day) via the StockTalks feature of Seeking Alpha.
On 9/6/2017, I re-entered a position in PSEC at a weighted average purchase price of $6.765 per share. On 10/16/2017 and 11/6/2017, I increased my position in PSEC at a weighted average purchase price of $6.285 and $5.66 per share, respectively. When combined, my PSEC position has a weighted average purchase price of $6.077 per share. This weighted average per share price excludes all dividends received/reinvested. Each PSEC trade was disclosed to readers in real time (that day) via the StockTalks feature of Seeking Alpha. I currently have a BUY recommendation on PSEC (however very close to my HOLD range).
On 6/5/2018, I initiated a position in TSLX at a weighted average purchase price of $18.502 per share. On 6/14/2018, I increased my position in TSLX at a weighted average purchase price of $17.855 per share. My second purchase was approximately double the monetary amount of my initial purchase. When combined, my TSLX position has a weighted average purchase price of $18.071 per share. This weighted average per share price excludes all dividends received/reinvested. Each TSLX trade was disclosed to readers in real time (that day) via the StockTalks feature of Seeking Alpha. I currently have a HOLD recommendation on TSLX.
On 10/12/2018, I initiated a position in ARCC at a weighted average purchase price of $16.40 per share. On 12/10/2018, 12/18/2018, and 12/21/2018, I increased my position in ARCC at a weighted average purchase price of $16.195, $15.305, and $14.924 per share, respectively. When combined, my ARCC position has a weighted average purchase price of $15.293 per share. This weighted average per share price excludes all dividends received/reinvested. Each ARCC trade was disclosed to readers in real time (that day) via the StockTalks feature of Seeking Alpha. I currently have a HOLD recommendation on ARCC.
On 10/12/2018, I initiated a position in SLRC at a weighted average purchase price of $20.655 per share. On 12/18/2018, I increased my position in SLRC at a weighted average purchase price of $19.66 per share, respectively. When combined, my SLRC position has a weighted average purchase price of $19.909 per share. This weighted average per share price excludes all dividends received/reinvested. Each SLRC trade was disclosed to readers in real time (that day) via the StockTalks feature of Seeking Alpha. I currently have a BUY recommendation on SLRC.
On 3/13/2019, I initiated a position in GAIN at a weighted average purchase price of $11.625 per share. On 6/6/2019, I increased my position in GAIN at a weighted average purchase price of $11.085 per share. When combined, my GAIN position has a weighted average purchase price of $11.257 per share. This weighted average per share price excludes all dividends received/reinvested. Each GAIN trade was disclosed to readers in real time (that day) via the StockTalks feature of Seeking Alpha. I currently have a HOLD recommendation on GAIN (however close to my BUY range).
All trades/investments I have performed over the past several years have been disclosed to readers in real time (that day at the latest) via the StockTalks feature of Seeking Alpha (which cannot be changed/altered). Through this resource, readers can look up all my prior disclosures (buys/sells) regarding all companies I cover here at Seeking Alpha (see my profile page for a list of all stocks covered). Through StockTalk disclosures, at the end of August 2019 I had an unrealized/realized gain "success rate" of 81.8% and a total return (includes dividends received) success rate of 93.2% out of 44 total positions (updated monthly; multiple purchases/sales in one stock count as one overall position until fully closed out [no realized total losses]). Both percentages experienced a minor-modest decrease in August due to the sell-off within the mortgage real estate investment trust (mREIT) sector; mainly due to narrowing net spreads and higher prepayments. I encourage other Seeking Alpha contributors to provide real time buy and sell updates for their readers which would ultimately lead to greater transparency/credibility.