With respect to our swing trading exploits, we like to trade the intermediate term. This means our go-to charts are the weekly chart and the daily chart. Obviously, it is always beneficial if the multi-year long-term trend (monthly chart) line-up with the intermediate term for example. This is always our objective - to ensure our trading is aligned with the long-term trend.
This can be difficult though when looking for a swing trade with short deltas for example. As the market has tacked on more than 2,300 points since March 2009, the lion's share of equities remain in a bullish trend. Shares of Insulet Corporation (NASDAQ:PODD) (The Insulin Provider) for example have been on a relentless rally since they bottomed in 2009. The multi-year trend is most definitely up.
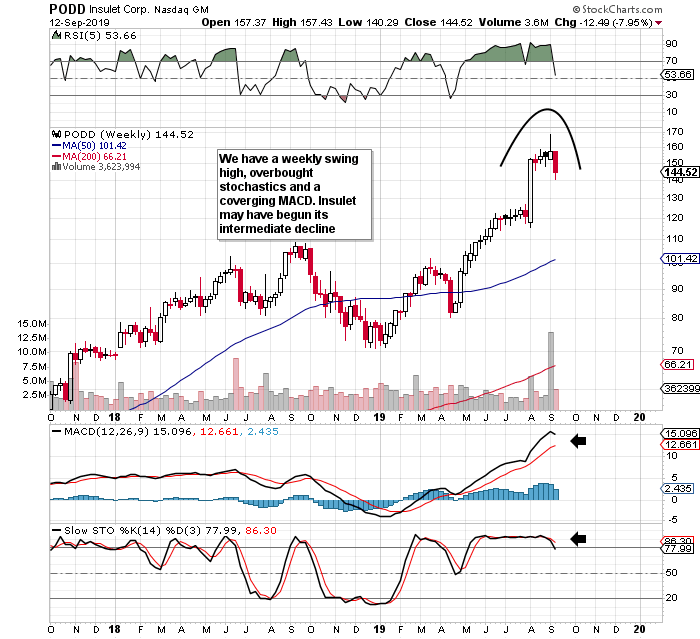
The long-term uptrend is also clearly visible on the weekly chart. What is attracting us though is the fact that the weekly slow stochastics have been at overbought levels for more than four months now. Eventually, these overbought conditions will revert back down to oversold. The question obviously is when.
Furthermore, although we do not have a cross on the MACD indicator as of yet, the moving averages are converging. If in the near term, the faster moving average crosses the slower one, this would be a convincing signal that the intermediate decline has begun in earnest.
So remember, up to now, we believe we may have the possibility of an intermediate decline in Insulet which would be a respite from the long-term upward trend. Let's see if the daily charts can further our case for a possible intermediate decline.
What is very interesting on the daily chart is that we have a potential exhaustion gap which still has not been filled. This kind of gap usually appears in the latter stages
----------------------
Elevation Code's blueprint is simple. To relentlessly be on the hunt for attractive setups through value plays, swing plays or volatility plays. Trading a wide range of strategies gives us massive diversification, which is key. We started with $100k. The portfolio will not stop until it reaches $1 million.
-----------------------