Micron: Darkness Before Dawn

Oct. 04, 2019 8:55 PM ETMicron Technology, Inc. (MU) StockMU55 Comments
Kwan-Chen Ma
11.94K Followers

Summary

  • Micron share price has historically led the relevant financial metrics, i.e., revenue, EPS, and gross margin, especially around turning points.
  • The commodity-like Micron stock also tends to lead the commodity prices (DRAM/NAND) at the bottom but lag at the top.
  • Micron stock prices already reflect future fundamentals. Thus, it is “double counting” or "circular reasoning" to infer redundant information from ER financials to predict future stock prices.
  • Since Micron stock price has already bounced off from the recent December low, the market should have baked in a forthcoming recovery while the near-term financials are still negative.
  • As Micron stock price has been on an uptrend since December, the recent -12% loss suggests that the market may have over-read the 4Q ER.

It must have been tough for Micron Technology’s (NASDAQ:MU) shareholders to swallow a perfectly fine 4Q earnings releases which turned into a 12% hit on the stock. The stock price seems to be in such a disarray in the last few days, as investors are anxiously searching for signs of bottoming in Micron’s financials. The common wisdom behind this line of thinking is that since share prices are determined by fundamentals, predicting future financials will help to predict future stock prices. In this note, I offer an alternative perspective: In a rational world, the stock price should be forward-looking. Thus, current stock price itself is a predictor of the future fundamental. If this argument has merit, you would expect that stock prices should lead the future (actual) fundamentals, and the obvious implication is that the market has no need to look for signs of bottoming in financials if the stock prices already bottomed.

Micron Prices Lead Micron Forward Financials

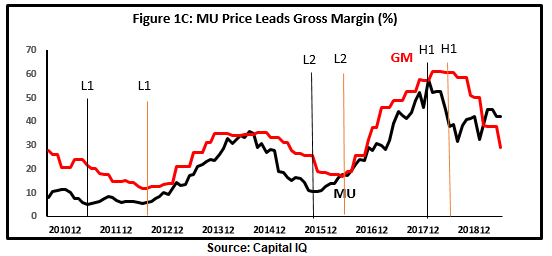
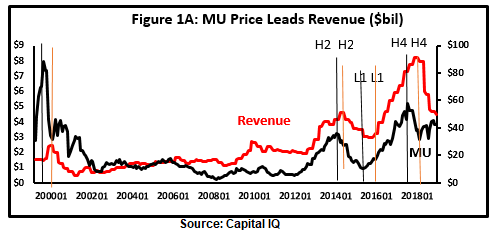
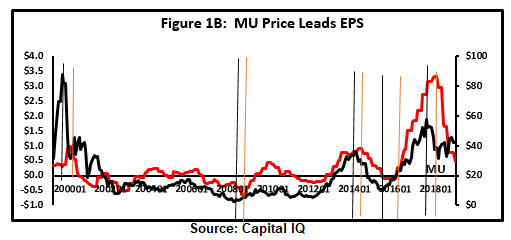
To see if this line of thinking has promise, I need to examine the inter-relationship between Micron stock prices and actual fundamentals. Over the last 20 years, Micron stock price movement has led the relevant financial metric’s move especially near the top and the bottom. For example, as shown in Figure 1A through Figure 1C, Micron’s stock price tends to lead its future revenue, EPS, and gross margin, as MU’s top (bottom) indicated by the black line is always ahead of fundamental’s top (bottom) indicated by the red line.
The reason why stock price leads future financials seems obvious because a rational stock market should always be forward-looking. The only assumption here is that the market price on average can predict the actual outcome.

The message that MU price leads actual financials is more than just an interesting pattern but suggests
This article was written by

11.94K Followers
K C Ma, Ph.D, CFA, is the Eminent Scholar and the Mary Ball Washington/Switzer Brothers Endowed Chair of Finance at University of West Florida. I am the Director of Argo Investments Institute which enables college students to manage real money stock, bond, and option funds. I manage market-neutral institutional hedge funds in KCM Asset Management. I write about stocks, bonds, and derivative strategies, long or short, based on our quantitative processes.

Analyst’s Disclosure:I/we have no positions in any stocks mentioned, and no plans to initiate any positions within the next 72 hours. I wrote this article myself, and it expresses my own opinions. I am not receiving compensation for it (other than from Seeking Alpha). I have no business relationship with any company whose stock is mentioned in this article.

Seeking Alpha's Disclosure: Past performance is no guarantee of future results. No recommendation or advice is being given as to whether any investment is suitable for a particular investor. Any views or opinions expressed above may not reflect those of Seeking Alpha as a whole. Seeking Alpha is not a licensed securities dealer, broker or US investment adviser or investment bank. Our analysts are third party authors that include both professional investors and individual investors who may not be licensed or certified by any institute or regulatory body.

Recommended For You

About MU Stock

SymbolLast Price% Chg
Market Cap
PE
Yield
Rev Growth (YoY)
Short Interest
Prev. Close
Compare to Peers

More on MU

Related Stocks

SymbolLast Price% Chg
MU
--