Black Friday and Cyber Monday are in the rear view, but it does not mean that Seeking Alpha readers cannot continue to do some bargain hunting. I have recently detailed companies trading at material discounts to their 52-week highs even as the broad market gauges hit new peaks. In articles over the last couple of weeks, I have examined:
In this article, I wanted to extend this examination of company laggards to the small-cap universe. After all, small caps (NYSEARCA:IJR) have underperformed mid-caps (MDY), which have in turn lagged the largest companies (SPY) as seen in the graph below of year-to-date returns. As we move into the smaller cap arena, the discounts to recent highs get larger and the list grows.
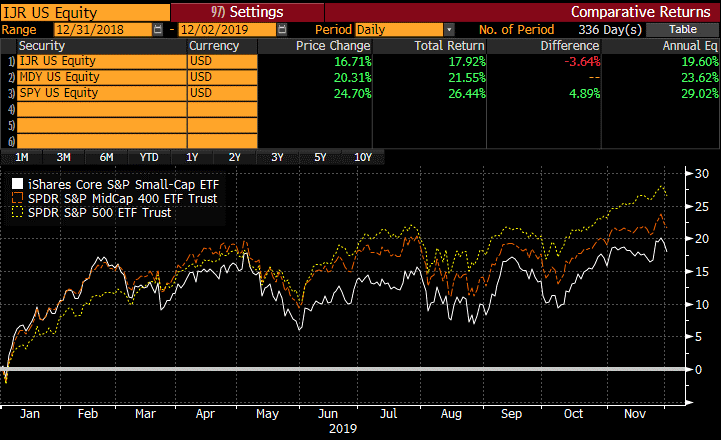 Source: Bloomberg
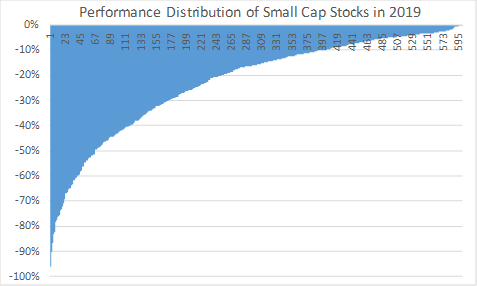
The graph below shows the distribution of S&P Small Cap constituents relative to their 52-week highs. The companies at the left of the distribution have lost most of their value in 2019. The companies at the right of the distribution are approaching their trailing 1-year high. While the large and mid-cap distributions also featured a tail of severe laggards, the tail in the small cap universe is decidedly "fatter".
 To drill into this tail, I have tabled the 66 companies that have shed at least 50% of their value from their recent highs below.
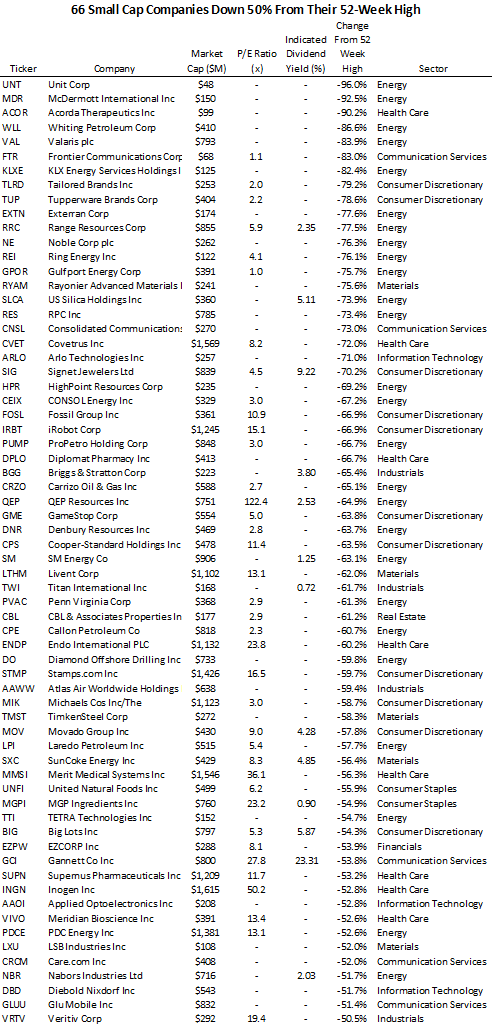 Drilling down into the 66 small-cap companies down at least 50% from their 52-week high, some themes emerge.
- Like in the small and mid-cap space, Energy was disproportionately represented on the laggards list. While Energy is just 4.4% of the S&P Small Cap 600, it is 32.6% of the market capitalization of this laggards list. As discussed in a recent article on the high yield bond market -