2019 has been yet another challenging year for oil & gas companies, with S&P Oil & Gas Exploration & Production ETF (NYSEARCA:XOP) down -9% year-to-date and an astonishing -70% from its peak in 2014, which is a stark contrast to major equity indices breaking to ever higher highs. From a long-term perspective, XOP is now teetering around the all-time low made in 2009:
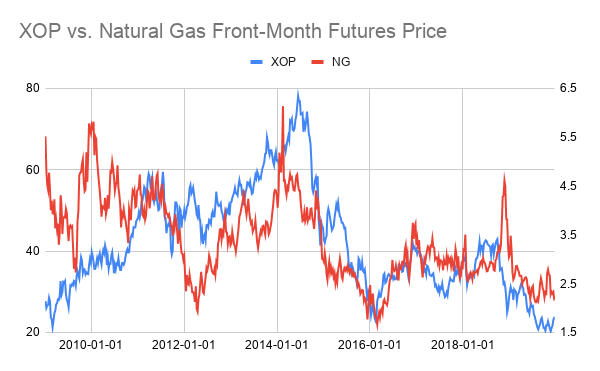 Falling natural gas prices (UNG) amid rising inventories has certainly been weighing on XOP. Crude oil (USO) recently breaking above $60 has done little to dampen the negative sentiment neither, as the supply overhang is expected to continue due to the "seemingly relentless growth in American oil production from the shale patch".
Boom, Bust, Consolidation
While the fundamental picture remains bleak, we pose the question: has the oil & gas E&P industry hit rock bottom? Looking at the XOP/NG ratio, a relative valuation measure of XOP per unit of natural gas, one observation is that after launching to all-time highs in early 2010s, the ratio has been stuck in a persistent downtrend and plunged through a long-term average this year:
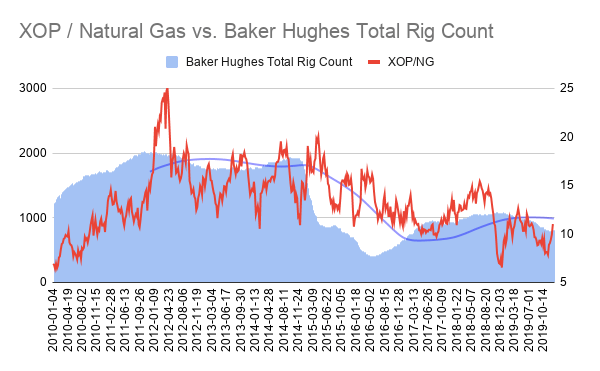
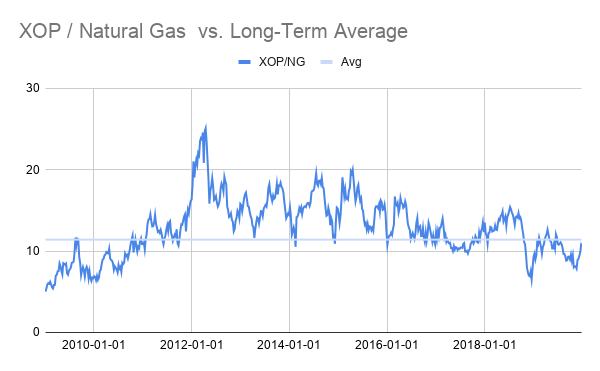 That said, after testing the lower bound of a wide horizontal range formed in the last decade, it has seemingly found support and is consolidating near the long-term average. The Baker Hughes total rig count, a business barometer of drilling industry, is likewise in the midst of a consolidation after bottoming out in 2016.
In our opinion, we are at the tail end of a boom and bust cycle during which a major bottom is being formed in the oil & gas industry after a consolidation phase. In fact, earnings may have actually bottomed out with companies adapting to lower prices. As Zacks points outs:
Over the past few years, energy producers worked tirelessly to cut costs to