Investment Thesis
Bearish weather headwinds will help to keep upside potential limited.
Despite a late session rally, natural gas prices settled lower on Friday
On Friday, the now expired January contract settled down 13.6 cents ($0.136) to $2.158/MMBtu, the new front-month February contract settled down 5.4 cents ($0.054) to $2.231/MMBtu, and the March contract settled down 4 cents ($0.004) to $2.173/MMBtu. Figure 1 below is a chart depicting the price trend of the front-month February contract over the past week.
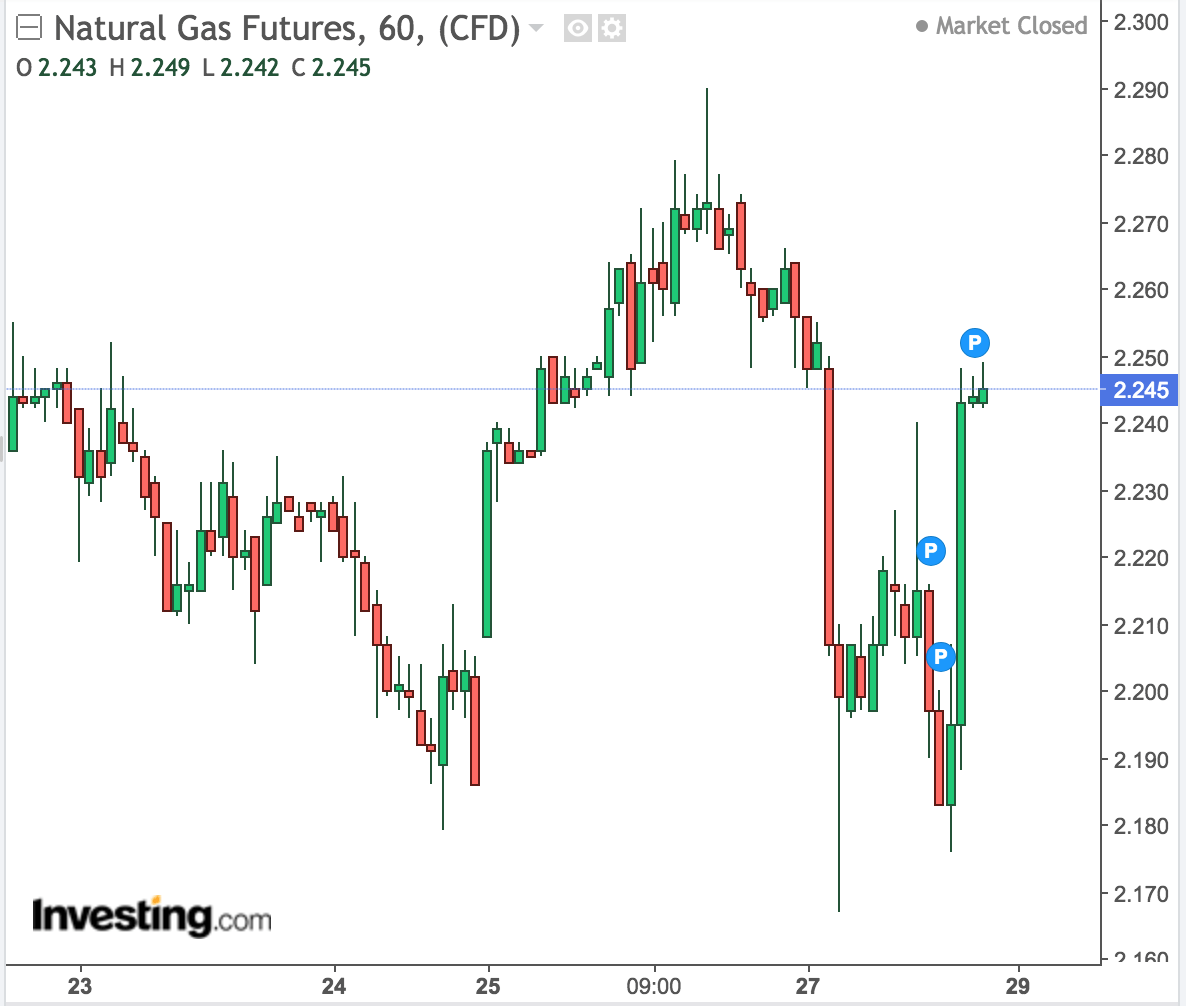 Source: Investing.com
On Friday, the United States Natural Gas ETF (UNG), which is the un-leveraged 1x ETF that tracks the price of natural gas, finished down 0.97% to $17.33.
UNG's leveraged exposure ETFs, the VelocityShares 3x Long Natural Gas ETN (UGAZ) and the ProShares Ultra Bloomberg Natural Gas ETF (BOIL), were seen lower by 3% and 1.03% at $79.60 and $8.61, respectively. Meanwhile, UNG's high-beta leveraged inverse ETFs, the VelocityShares 3x Inverse Natural Gas ETN (DGAZ) and the ProShares UltraShort Bloomberg Natural Gas ETF (KOLD), were seen higher by 2.87% and 1.02% at $168.30 and $37.54, respectively.
EIA posted a bullish inventory report on Friday with a hefty draw of -161 Bcf for the week ending Dec. 20; markets largely ignore due to bearish headwinds
The Energy Information Administration released its weekly natural gas storage report on Friday morning. The report revealed a massive/bullish inventory draw of -161. This came within, albeit on the higher end, the trade range of -136 to -164 BCF, and higher than the consensus withdrawal estimate of -148 BCF. The draw of -161 BCF for the week ending December 20 was seen as bullish compared to the -61 BCF withdraw from a year ago and versus the five-year average withdraw of -101 BCF. Stockpiles now stand at 3,250 BCF vs. 2,732 BCF a year ago and the five-year average of 3,319 BCF. Stocks are now 518 BCF higher than last year, but