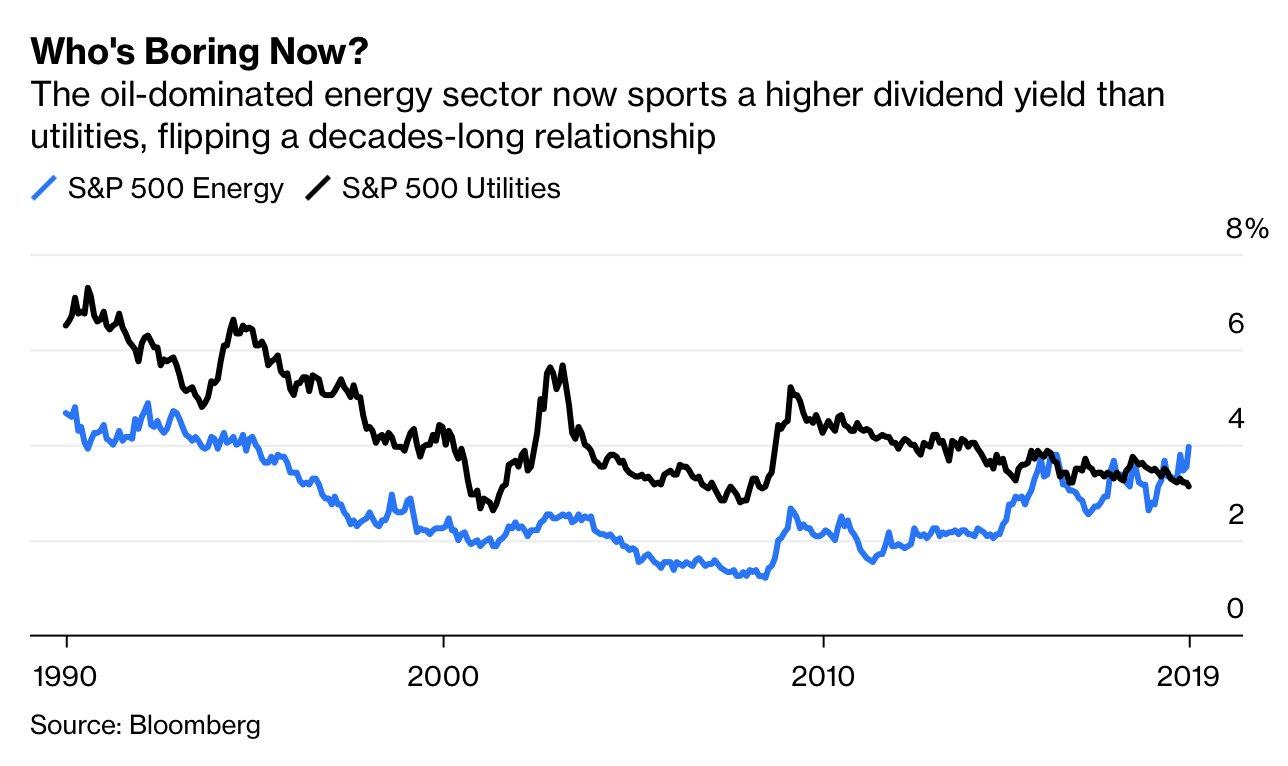
As 2019 drew to a close, the utilities sector (NYSEARCA:XLU) was in the spotlight after Bloomberg made an interesting observation that utilities' dividend yield dropped below the energy sector's (XLE) dividend yield, "flipping a decades-long relationship" in the process. To wit:
The inversion of these two sector yields means that what was once priced as growth is now priced as value, and vice versa.
The author has a point regarding the growth story between the two sectors, as XLU's dividend payout has grown for 9 consecutive years while XLE's has been uneven at best since peaking in 2015:
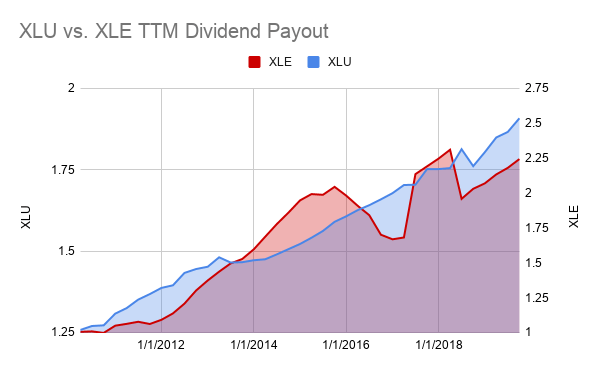 Indeed, although the annual growth rate has been in the single digits, on aggregate, XLU's dividend payout growth in the last 5 years outpaced XLE's by 6%:
| TTM Dividend Payout | XLU | XLE | XLU YoY Growth | XLE YoY Growth |
| 2010 | 1.272 | 0.997 | -0.08% | -3.58% |
| 2011 | 1.368 | 1.061 | 7.55% | 6.42% |
| 2012 | 1.445 | 1.301 | 5.63% | 22.62% |
| 2013 | 1.466 | 1.527 | 1.45% | 17.37% |
| 2014 | 1.506 | 1.859 | 2.73% | 21.74% |
| 2015 | 1.59 | 2.044 | 5.58% | 9.95% |
| 2016 | 1.659 | 1.701 | 4.34% | -16.78% |
| 2017 | 1.752 | 2.191 | 5.61% | 28.81% |
| 2018 | 1.761 | 2.03 | 0.51% | -7.35% |
| 2019 | 1.908 | 2.243 | 8.35% | 10.49% |
| XLU | XLE | |||
| 3-Year Growth | 15.01% | 31.86% | ||
| 5-Year Growth | 26.69% | 20.66% |
In 2019, XLU's dividend payout actually grew at the highest clip of the decade, which along with the renewed plunge in bond yields contributed to XLU's best performance since 2014. In terms of its relative value with bonds, the spread between XLU's dividend yield and 10-year Treasury yield rebounded from zero all the way to just under the long-term average of 1.2%:
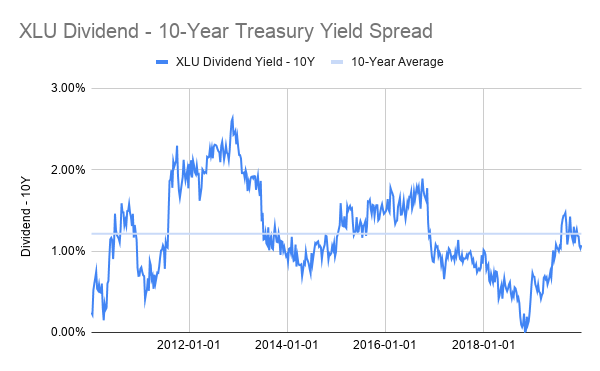
In other words, after turning the most overvalued relative to bonds in a decade, the steep decline in 10-year Treasury yields completely reversed the narrative as the utilities sector is now fairly valued according to its historical yield differential