Buying The Dip Versus Selling Now: The Key Factor To Watch

Jan. 13, 2020 6:00 PM ET, , , , 14 Comments

Summary

  • The bull market continues unabated in spite of economic and political uncertainties.
  • If you are looking to understand the main drivers behind this bull market, global liquidity and easy credit conditions are arguably the most important variables to consider.
  • A short-term correction should be no surprise at these levels, and it can even be expected sooner rather than later.
  • That said, as long as liquidity keeps flowing well, chances are that the long-term bull market will remain in place, and corrections should be considered buying opportunities.
  • I do much more than just articles at The Data Driven Investor: Members get access to model portfolios, regular updates, a chat room, and more. Get started today »

The bull market in stocks is reaching record proportions, and prices seem to defy all kinds of concerns. In this scenario, investors have reasons to wonder if they should be buying stocks to ride the bull market higher or selling positions in anticipation of a turnaround.

Chasing prices at these levels is clearly too dangerous and should be avoided. However, as long as liquidity conditions are favorable and money is flowing smoothly through the economy, short-term pullbacks should be considered buying opportunities.

The Most Important Driver For The Bull Market

The trade war, the slowdown in manufacturing, the military conflicts in the Middle East, the coming elections and political risk, expensive valuations, and declining earnings expectations are just some of the many risk factors that have been considered as potential threats to the bull market.

However, markets have continued to perform well in spite of all this uncertainty. This rock-solid resiliency is mostly due to the fact that the Fed and other central banks all over the world are providing massive amounts of liquidity, and such liquidity is flowing smoothly across both the real economy and financial markets.

The chart below shows the evolution of the S&P 500 (SP500) versus the size of the major central banks' balance sheets. An image is worth a thousand words, and it's easy to see how liquidity and asset prices are closely related.

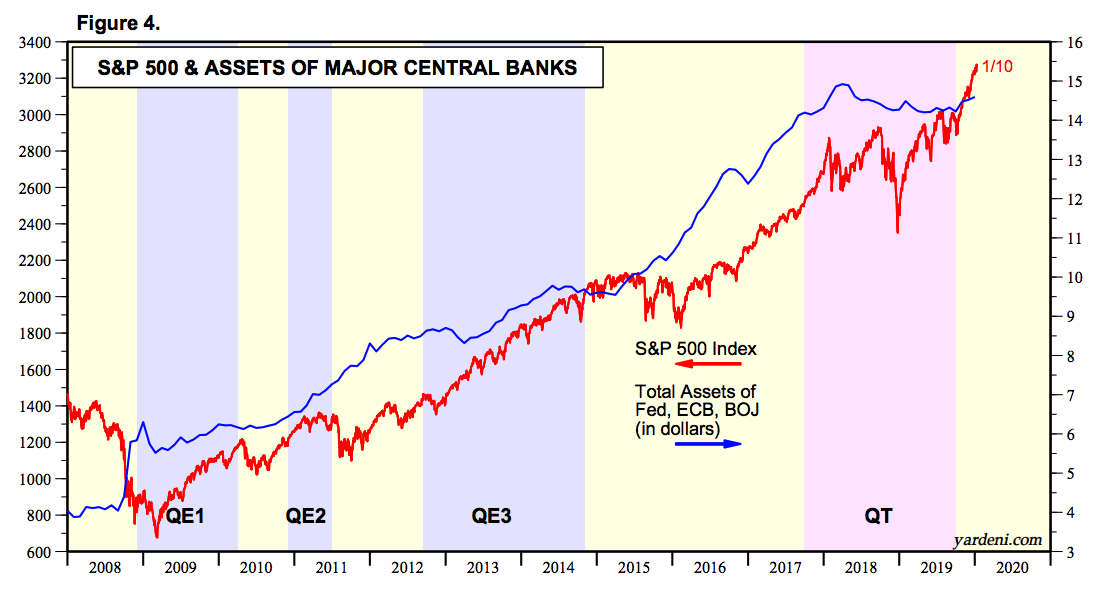
Source: Yardeni Research

When companies have access to cheap credit, this provides the resources to make all kinds of investments, and also to distribute capital to investors through dividends and buybacks.

The chart below shows the relationship between the S&P 500 and high yield credit spreads, with shaded areas representing recessions. The big bear markets in stocks generally come during recessions, and recessions generally happen when credit spreads are increasing. In a nutshell, recessions and bear

The Credit Market Model is updated monthly in The Data Driven Investor. A subscription to The Data Driven Investor provides you with solid strategies to analyze the market environment, control portfolio risk, and select the best stocks and ETFs based on quantitative factors. Our portfolios have outperformed the market by a considerable margin over time, and they are built on the basis of solid quantitative research and statistical evidence. Click here to get your free trial now, you have nothing to lose and a lot to win!

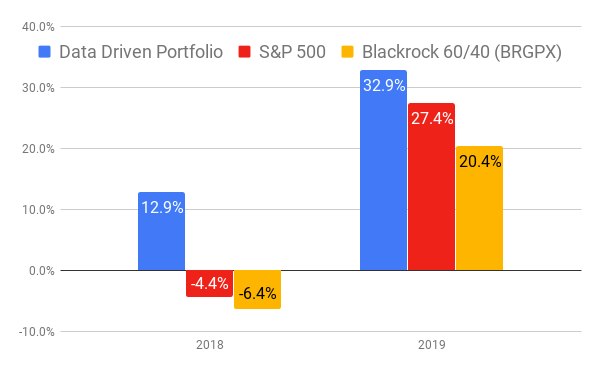
Performance as of December 31, 2019

This article was written by

35.5K Followers

Andres Cardenal, CFA, is an economist with 20 years working in investment research and strategy development for hedge funds, family offices and asset managers in the U.S. and Latin America.

He leads the investing group The Data Driven Investor, where he offers evidence-based analysis on Growth Stocks, Options Ideas for short-term consistent income generation, Macro analysis, Quant Portfolios for momentum and dividend investors and ETF strategies. The service features an active chat room and an engaged community of serious investors. Learn More.

Analyst’s Disclosure:I/we have no positions in any stocks mentioned, and no plans to initiate any positions within the next 72 hours. I wrote this article myself, and it expresses my own opinions. I am not receiving compensation for it (other than from Seeking Alpha). I have no business relationship with any company whose stock is mentioned in this article.

Seeking Alpha's Disclosure: Past performance is no guarantee of future results. No recommendation or advice is being given as to whether any investment is suitable for a particular investor. Any views or opinions expressed above may not reflect those of Seeking Alpha as a whole. Seeking Alpha is not a licensed securities dealer, broker or US investment adviser or investment bank. Our analysts are third party authors that include both professional investors and individual investors who may not be licensed or certified by any institute or regulatory body.

Recommended For You

Related Stocks

SymbolLast Price% Chg
HYG--
iShares iBoxx $ High Yield Corporate Bond ETF
IEF--
iShares 7-10 Year Treasury Bond ETF
SP500--
S&P 500 Index
SPY--
SPDR® S&P 500® ETF
TLT--
iShares 20+ Year Treasury Bond ETF

Related Analysis