The New 60/40

Ploutos
20.97K Followers

Summary

  • A 60/40 mix between stocks and bonds has historically been a rule of thumb for investors wishing to mute some of the volatility of equities.
  • With lower forward expected returns on equities and fixed income, will the 60/40 portfolio return continue to deliver for investors?
  • This article compares the 60/40 heuristic versus low volatility equities, which also offer lowered equity volatility akin to a bond allocation.
  • I also examine the performance of an 80/20 strategy that features low volatility equities in lieu of a more traditional stock allocation.
  • Results of the different strategies are compared over the nearly three decades of data available for my chosen low volatility equity index.

Historically, a portfolio mix of 60% stocks and 40% bonds has been a formula for long-term investing success. This heuristic was commonly used by pension funds to capture a portion of the upside of equity markets while the bond component cushioned returns in weak market environments. As equity market rallied and lower interest rates buoyed bond returns in 2019, 60/40 produced tremendous performance. However, the traditional 60/40 portfolio still underperformed a strategy that I have previously discussed on this platform.

Graphed below is the annual performance of a 60/40 combination of the S&P 500 (SPY) and the Bloomberg Barclays U.S. Aggregate Index (AGG). I have graphed the annual return of a 60/40 portfolio back to the earliest available returns available for the bond component of that portfolio. Last year was the best performance for the 60/40 mix since 1997.

Annual returns of 60/40 portfolio

On this blog, I have espoused a tilt towards low volatility equities, and a lower allocation to the fixed income portion of the 60/40 portfolio. To dig into a comparison with the balanced 60/40 portfolio, I used the S&P 500 and the Bloomberg Barclays U.S. Aggregate Index as my representations of equity and fixed income respectively. For Low Volatility stocks, I used the S&P 500 Low Volatility Index, which tracks the performance of the one-hundred lowest volatility constituents of the broader S&P 500.

The table below lists performance figures for the equity index (SPX), the bond index, the 60/40 portfolio of stocks and bonds, low volatility stocks (LV), and an 80/20 portfolio of low volatility stocks and bonds over this long study period. Annual return data dates to 1991, the longest available period of annual returns for my chosen Low Volatility Index.

60/40 performance versus low volatility equities

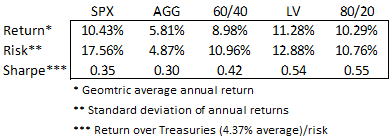
Even with stocks near all-time highs, the 60/40 portfolio (rebalanced annually in this example) has trailed the standalone S&P 500 by just

This article was written by

20.97K Followers
Institutional investment manager authoring on a variety of topics that pique my interest, and could further discourse in this online community. I hold an MBA from the University of Chicago, and have earned the CFA designation. My articles may contain statements and projections that are forward-looking in nature, and therefore inherently subject to numerous risks, uncertainties and assumptions. While my articles focus on generating long-term risk-adjusted returns, investment decisions necessarily involve the risk of loss of principal. Individual investor circumstances vary significantly, and information gleaned from my articles should be applied to your own unique investment situation, objectives, risk tolerance, and investment horizon.

Analyst’s Disclosure:I am/we are long SPLV, SPY, XSLV, XMLV, EFAV, EEMV. I wrote this article myself, and it expresses my own opinions. I am not receiving compensation for it (other than from Seeking Alpha). I have no business relationship with any company whose stock is mentioned in this article.

Seeking Alpha's Disclosure: Past performance is no guarantee of future results. No recommendation or advice is being given as to whether any investment is suitable for a particular investor. Any views or opinions expressed above may not reflect those of Seeking Alpha as a whole. Seeking Alpha is not a licensed securities dealer, broker or US investment adviser or investment bank. Our analysts are third party authors that include both professional investors and individual investors who may not be licensed or certified by any institute or regulatory body.

Recommended For You

About SPLV ETF

SymbolLast Price% Chg
Expense Ratio
Div Frequency
Div Rate
Yield
Assets (AUM)
Compare to Peers

More on SPLV

Related Stocks

SymbolLast Price% Chg
SPLV
--