Investment Thesis:
A review of ETFs each focusing on stocks to hold from a specific narrow industry now points to semiconductors as a best-choice near capital gain buy, with SPDR S&P Semiconductor ETF (NYSEARCA:XSD) the favored candidate.
XSD not the only opportunity
But it's one of the better ones, particularly among typically more placid ETFs. To find others, we looked at dozens of ETFs with holdings specialized by industry. Their Reward to Risk tradeoffs were the first test, shown in Figure 1.
Figure 1
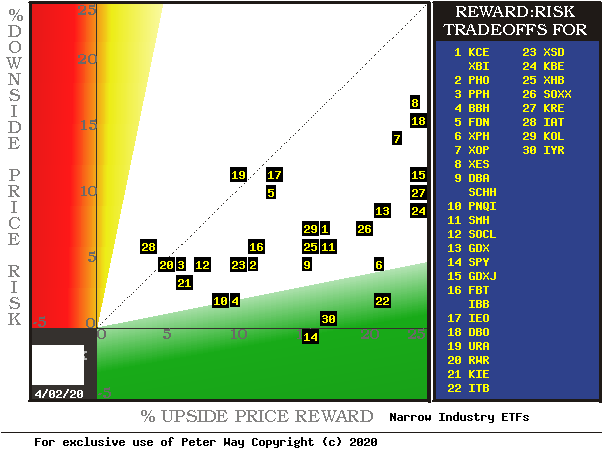
Source: Author
This map locates securities at the intersection of prospective price gains (green horizontal scale) and potential price drawdowns (red vertical scale) based on market-maker hedging behavior to protect their necessary endangerment of firm capital as they enable volume trades. Desirable conditions are down and to the right.
The "frontier" of best advantage runs from PNQI at location [10] to SPY at [14] to ITB at [22]. SPDR S&P 500 Index Trust (SPY) at [14] involves a statistically unreliable sample of prior forecasts, as does IYR at [30] and ITB. XSD is of interest to us at [23].
Comparing Investment Details
Additional characteristics of investment attraction to the more interesting ETFs are highlighted in Figure 2.
Figure 2
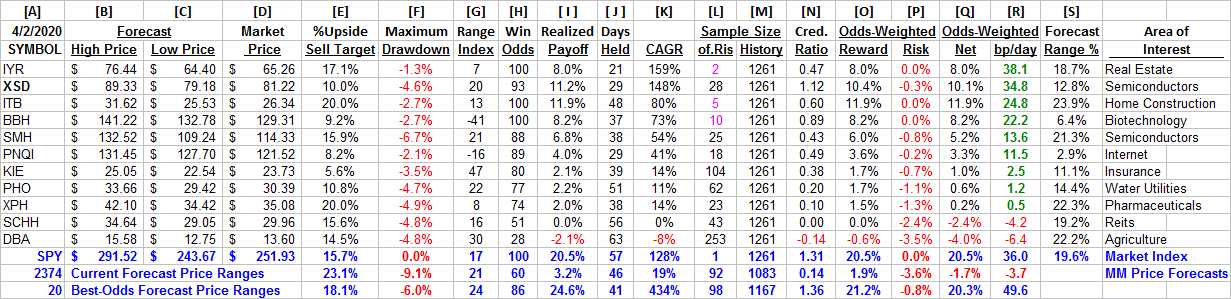
Source: Author
The hedging-implied price-range forecasts are in columns [A] to [D], with upside prospect [E] calculated from [B] and [D].
The remaining columns are based on prior 5-year histories of each stock's price changes following only those points in time when forecasts were similar in proportions of upside-to-downside price change like what is being seen today. The measure of that balance we call the Range Index [RI], and its numeric is the percentage of the [B] to [C] range between [D] and [C]. So, a stock with a RI "cost" of 25 appears to have 3 times as much upside price gain prospect as price drawdown exposure.