The CAD/JPY currency pair, which expresses the value of the Canadian dollar in terms of the Japanese yen, is one of the more volatile FX crosses, which has proven to be case recently. The chart below illustrates recent CAD/JPY price action, which follows a sell-off in global equities, as well as a crash in oil prices.
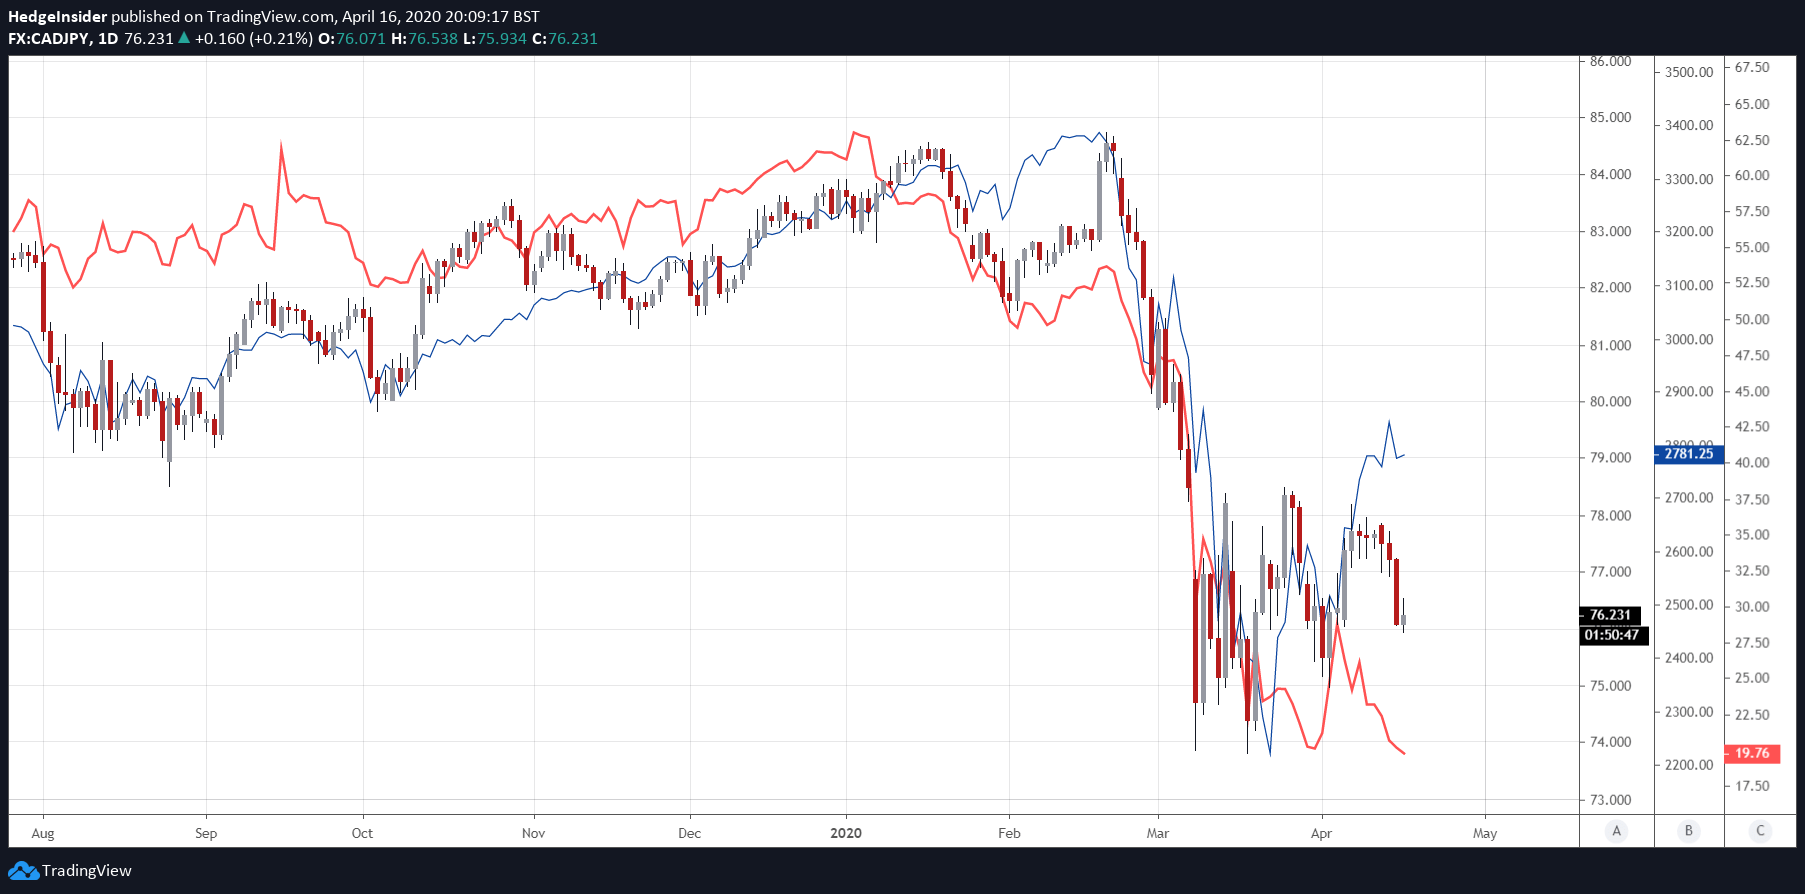
(Chart created by the author using TradingView. The same applies to all subsequent candlestick charts presented hereafter.)
CAD/JPY is illustrated using daily candlesticks, while the blue line represents S&P 500 futures prices (a proxy for U.S. equity performance) and the red line represents WTI crude oil prices.
The rapid downside volatility resulted in CAD/JPY dropping from just under 85 to briefly under 74 in a matter of less than three weeks (a drop of about 13%). Oil exports are important for Canada, as illustrated in the chart below which illustrates some of the country's key export categories.
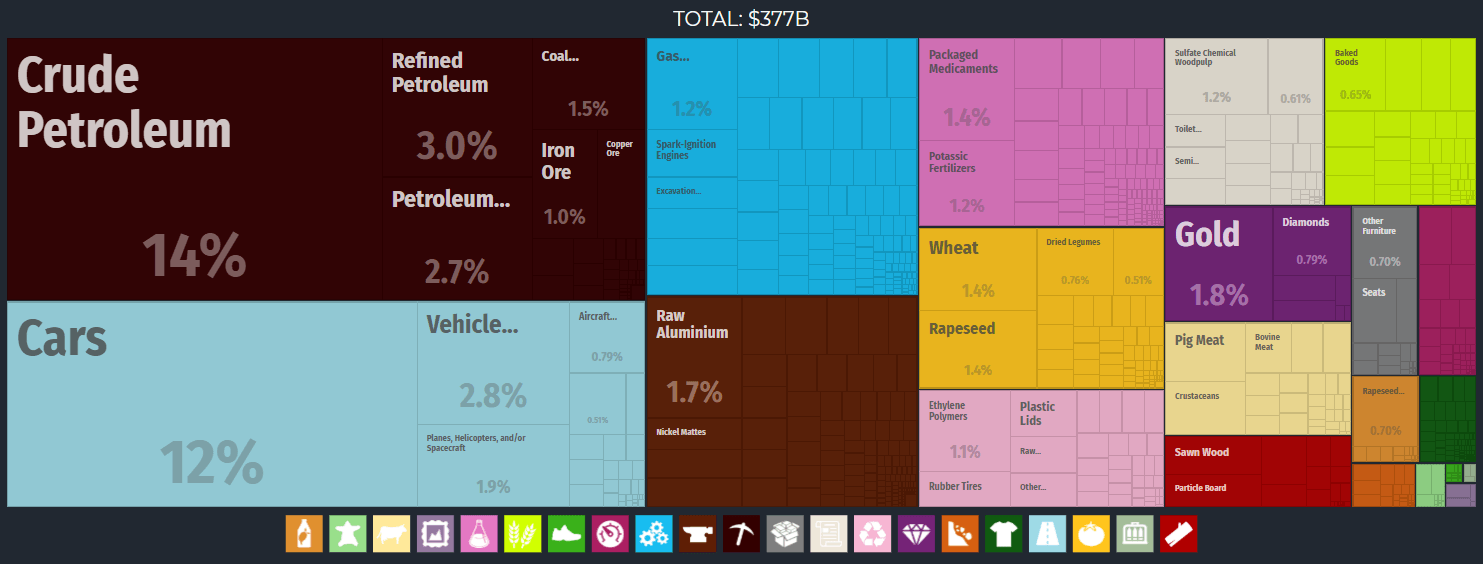
(Source: The Observatory of Economic Complexity)
A reduction in the value of key exports negatively affects a country's terms of trade, which is to say the relative price of exports versus imports (the ratio of export prices to import prices). A country's terms of trade indicate the amount of imports an economy can purchase per unit of exports goods. If oil falls in value, Canada's terms of trade falls, and this can put pressure on the Canadian dollar directly.
Also, since the oil industry is important to Canadian industry and, therefore, to the domestic economy (including macroeconomic indicators: employment and inflation), a reduction in oil prices can threaten significant numbers of jobs in the country. Indeed, fuel and electricity production (i.e., the country's energy industry, including conventional oil and gas production) contributed to about 10% of Canadian GDP in 2012 (see below).
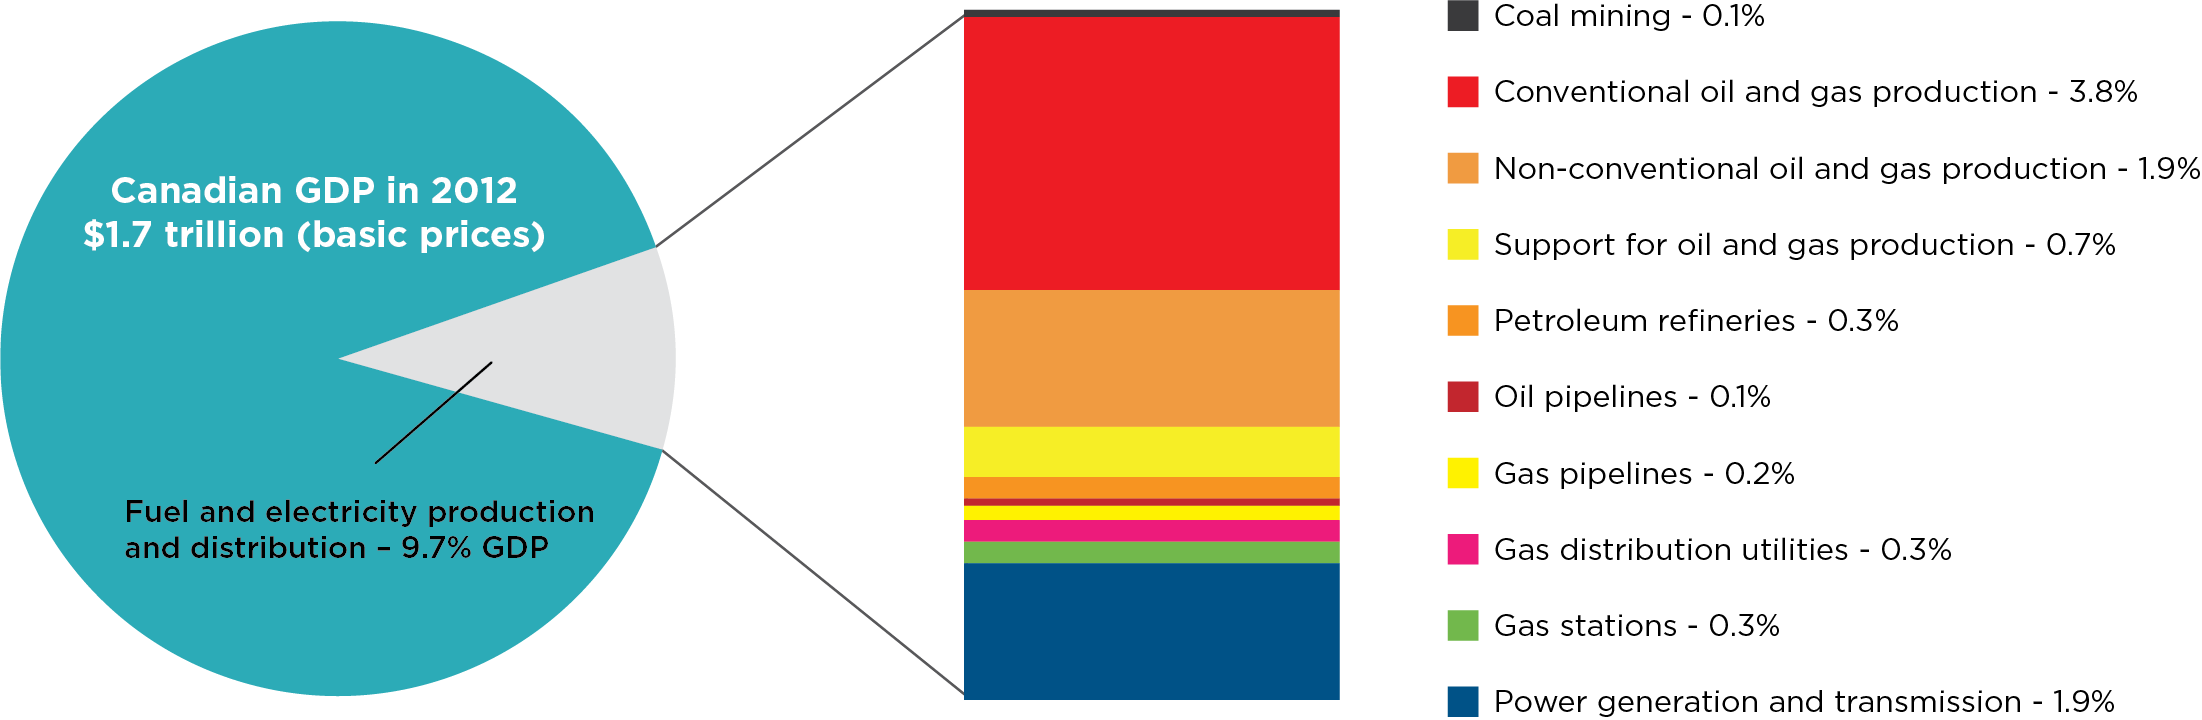
(Source: Energy Exchange)
It is