The Buy Thesis
In a sum-of-the-parts valuation, we believe Iron Mountain (NYSE:IRM) is clearly worth more than its market price. Its 3 main segments are:
- Records Information Management or RIM
- Data Centers
- Data Center growth pipeline
I understand that it is unusual to ascribe value to a pipeline, but we will detail why this has discernable value. The market seems to be valuing IRM exclusively on its RIM business with the rest getting overlooked.
Confusion discount
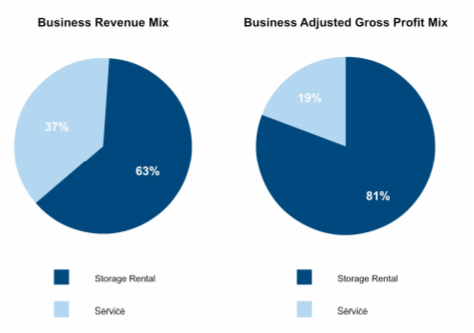
The data security REIT has not been able to get the market's attention when it comes to their data center business. As presented, their data center revenues get lost in the sea of storage revenues and the market is simply not giving IRM credit for either its current data center profitability or its substantial pipeline in the space. Part of the issue is the way IRM labels its revenues into just 2 buckets; storage rental and service.
Source: IRM 4Q19
Within the legacy RIM business, storage rental refers to the revenues they get from storing boxes on behalf of their clients and service revenue is stuff like document shredding and physical to digital conversions.
Oddly, IRM uses the exact same labels (storage rental and service) to describe their data center business. Thus, the data center revenues just get lost in the mix.
I believe this is evident in IRM's multiple
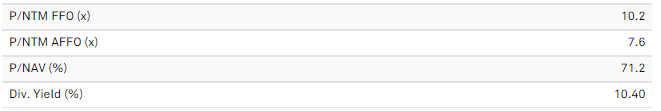
Most of the data centers trade around 20X FFO.
So, to cut through the amalgamation that is IRM's presentation of its revenues we are valuing each part individually.
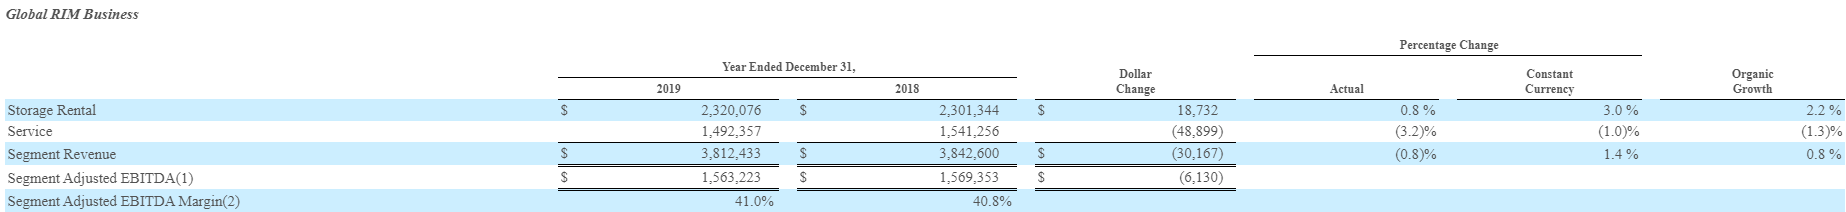
What is RIM worth?
Well we know the revenue of RIM to be $3.812B annually and the EBITDA to be $1.563B.
 Source: IRM
So the question is, what multiple should be applied to this?
Of the 181 REITs, 177 clearly report enterprise value and EBITDA in their filings. Among these 177, the median EV/EBITDA is 13.8X and the mean is 15.7X (data aggregated from SNL Financial).
Contributing factors to a higher multiple are
- Growth
- Margin
- Capex intensity
IRM's RIM business looks reasonably good in each of these factors.
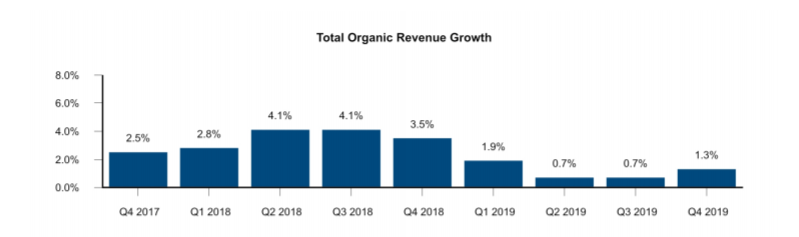
Organic growth is not rapid, but consistently positive.
 Source: IRM
At 41%, margins are healthy and capex is reasonably low as storage facilities don't require all that much dressing up. IRM's main capex is its fleet of trucks that transport documents to and from their facilities.
Bears, however, would argue that the growth is going to turn negative due to a secular trend toward digitization and away from physical documents. IRM is partially insulated from this trend as they actively profit from physical to digital conversions, but it is a slight risk to volume. Another insulating factor is that while growth has substantially slowed in the U.S. it has held strong internationally.
Additionally, some of IRM's business cannot go digital. Fine art and other precious objects are trusted to IRM for their longstanding reputation as the best in the business.
Overall, I do think the bear case has some merit to it and RIM's growth will likely slow to about 0 with international growth and price growth offsetting some volume loss. As such, RIM deserves a slightly lower multiple than the average REIT which is growing (other than the present environment). I would propose an 11X EBITDA multiple on RIM or a value of $17.19B.
What are its data centers worth?
With a large data center acquisition in Phoenix in August of 2019, the full year number does not capture the run rate. Instead, I would propose using an annualized 4Q number as this would capture at least some of the revenues from the acquisition. As seen below data center EBITDA annualizes to about $142.4mm.
![]()
Source: IRM
Data centers have many different functions each with slightly different margins;
- Colocation
- Turnkey flex
- Hyperscale
- Enterprise
As such, it can be tricky to compare the various data center REITs as some report the net rentable square feet of their data centers while others report megawatts being used. Below is the comparable information we were able to compile.
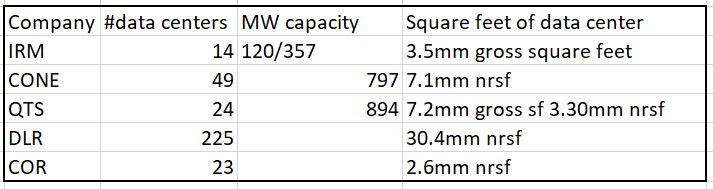 Data from company filings
Note that gross square feet is usually twice the rentable square feet, so IRM's DC portfolio is about half the size of QTS Realty Trust (QTS) and about 2/3 the size of CoreSite Realty (COR).
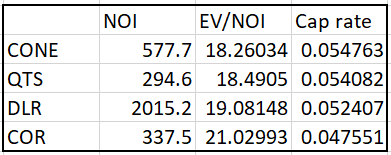
QTS, for example is focused on having ample power capacity while CONE is more focused storage capacity. The most comparable figure is the profitability because all data center REITs report EBITDA and the advantages/disadvantages of each data center REIT impact the amount of EBITDA they can generate.
Each of the data center REITs is trading at an EV/EBITDA in the 20s with an average of 25.2.
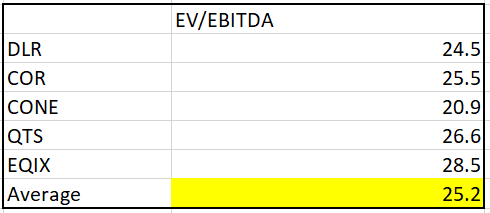
Source: SNL Financial
If we value IRM's data center EV at this multiple, its data center portfolio is worth $3.58B.
Why would IRM, as a reasonably new player in the space, get the same multiple as its peers?
The answer lies in the growth pipeline.
The value of a DC growth pipeline
Data center REITs trade at substantially higher multiples than the rest of REITs, but for a rather unusual reason; external growth.
Organic growth of data center REITs is entirely unimpressive. Digital Realty (DLR), which is arguably the bellwether of the sector due to its enormous size, actually has substantially negative organic growth.
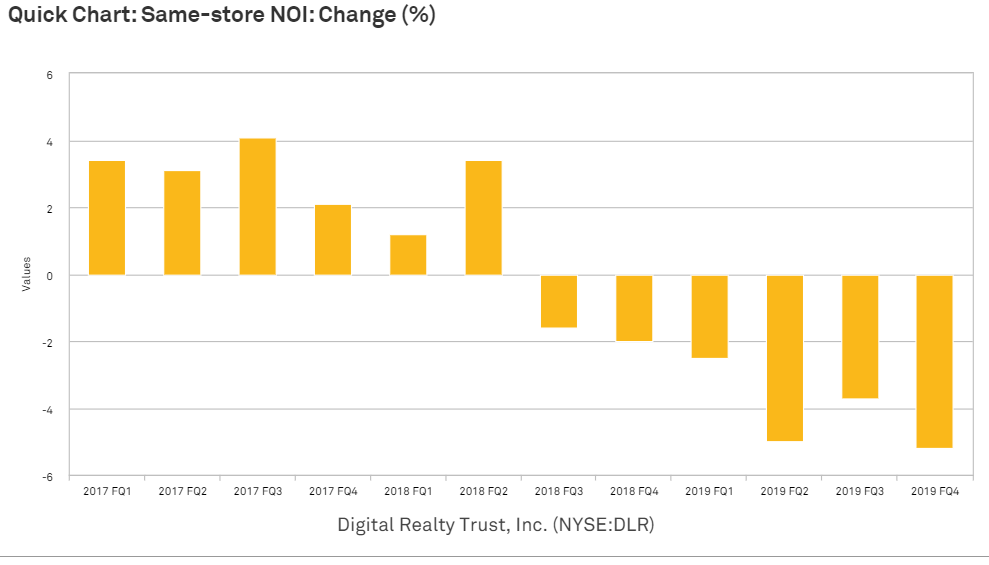 Source: SNL Financial
I cannot emphasize enough how rare it is for a REIT with 6 quarters in a row of significantly negative same store NOI growth to trade at a high multiple. The other high multiple sectors like industrial and towers have strongly positive organic growth.
In data centers, however, organic growth is continually plagued by a powerful tenant base with companies like Facebook (FB) being able to bully the REITs into rent reductions. The fungibility of data centers makes the threat of re-signing with a different DC provider a powerful negotiating tool. The tenants can even threaten to build their own centers as FB, GOOG and AMZN have all shown the ability to do so.
So while data center internal growth rates are unimpressive, the true value lies in the seemingly infinite external growth. Demand for data has been growing exponentially and with the stay at home economy that growth rate has accelerated even further. Thus, it is quite valuable to have a DC development pipeline as it provides a strong and reliable return in a world where returns are otherwise extremely low (due to interest rates).
In this regard, Iron Mountain is as well positioned or better positioned than the other data center REITs. It has a massive amount of land and development rights that allow it to triple the size of its DC portfolio from 120MW to almost 360MW.
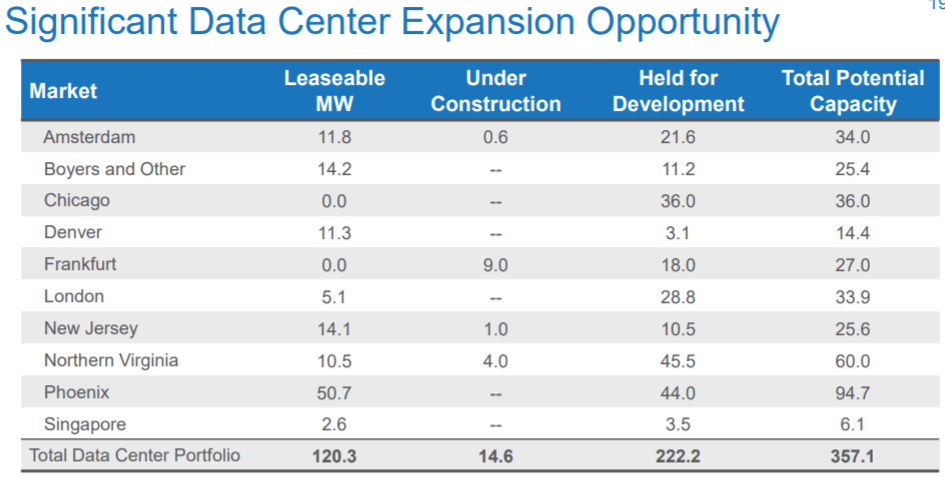 Source: IRM
With just the under construction and held for development, IRM can become one of the bigger data center REITs. It can surpass QTS and COR in nrsf.
Development cap rates are substantially higher than the roughly 5% at which DCs end up being valued. This nets significant value to the developer.
Data from SNL Financial and compiled in Excel
Over time, as IRM builds out its developable DCs, it will accrete this value. Given how low IRM's market price is, raising equity capital could be challenging. Fortunately, it has a somewhat conservative payout ratio with 2020 anticipated AFFO (S&P Capital IQ consensus) of $3.23 compared to a $2.47 dividend.
With 287.8mm shares outstanding, this leaves about $218mm of excess AFFO annually after paying dividends. Much of this can be invested in DC development.
Valuation
- RIM business based on an 11X EBITDA multiple is worth $17.19B
- DC business using peer average 25.2X EBITDA multiple is worth $3.58B.
Total value of $20.77B. Subtracting out $12.284B of liabilities and $67.6mm of minority interest, leaves $8.418B for common equity.
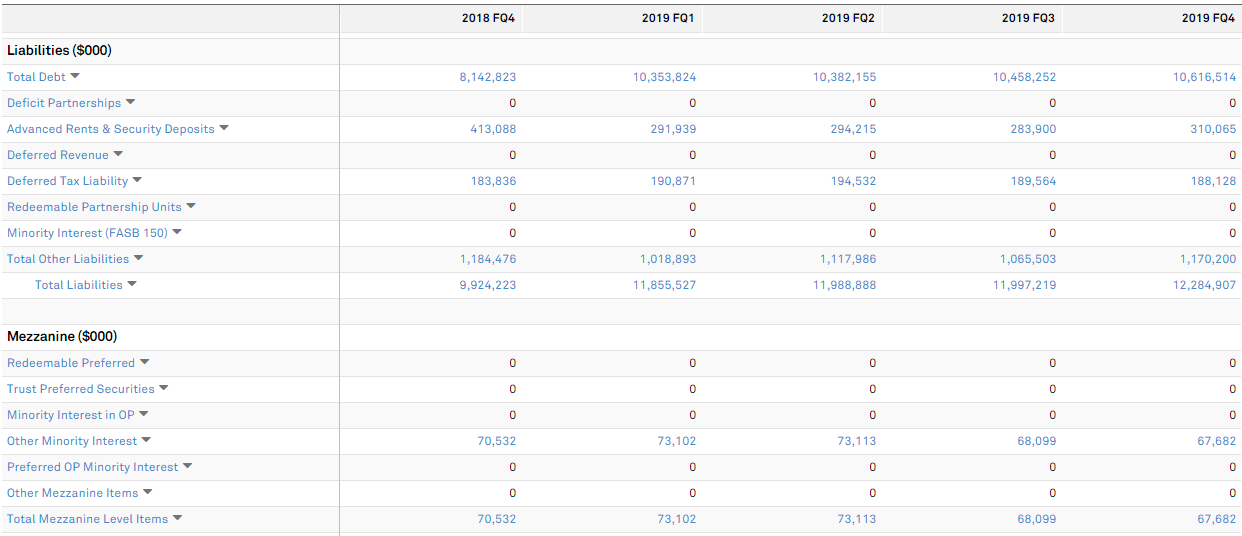 Source: SNL Financial
Divided over 287.8mm shares we see fair value of about $29.25 per share. While it represents 22% upside against current price, it is rather conservative relative to $34.39 consensus NAV (provided by SNL Financial).
In the current environment
The market has generally done a good job of understanding which companies are most and least impacted by the economic shutdown. Data centers have risen as demand for their services rises in the stay at home economy.
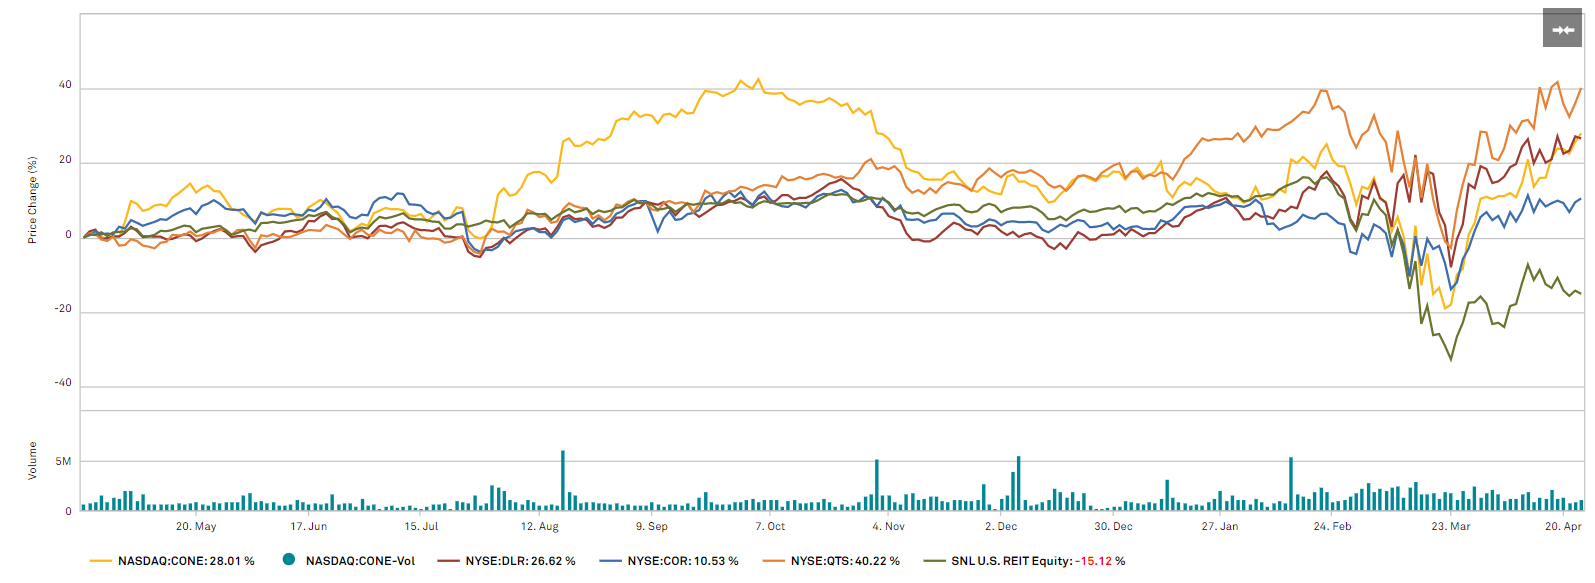 Source: SNL Financial
Iron Mountain seems to have fallen through the cracks as it is actually down more than the REIT index.
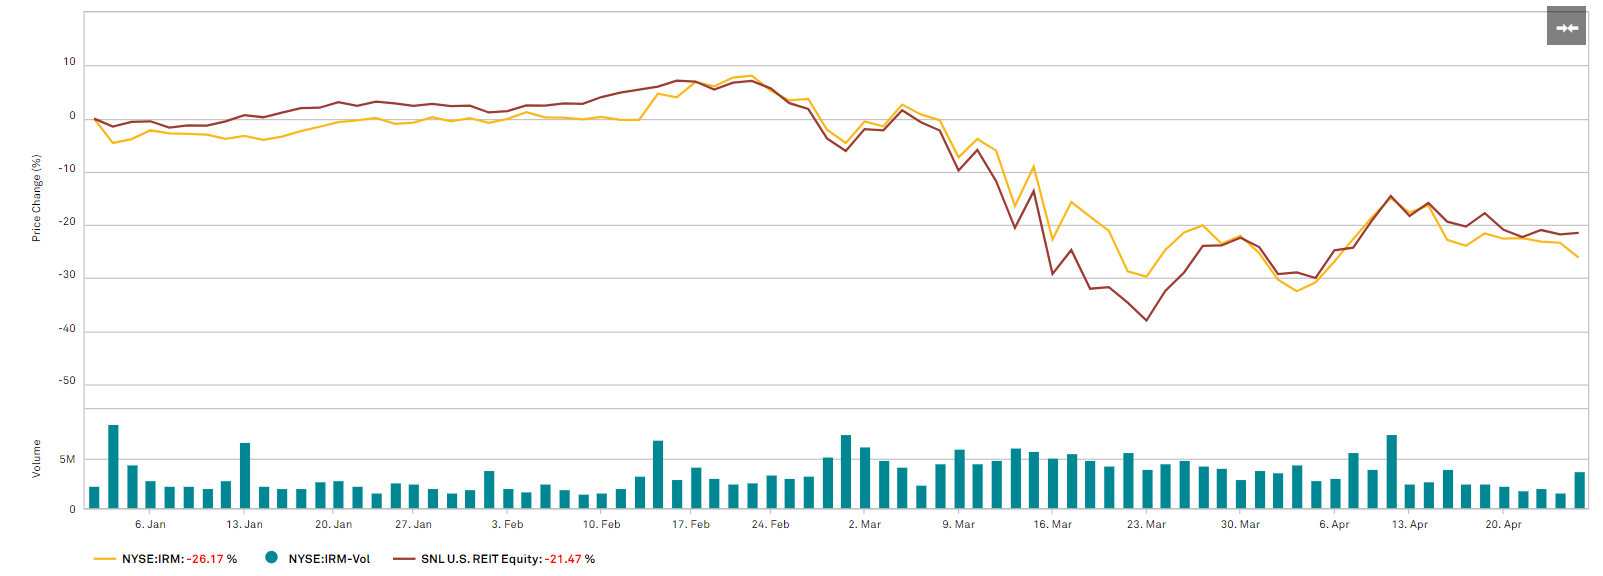 Source: SNL Financial
This drop seems entirely inappropriate given the resilience of IRM fundamentally under these circumstances.
Its RIM business should be largely unaffected. Documents in storage will simply stay in storage. Almost none of IRM's business involves social interaction and boxes can still be picked up and dropped off.
Its data center business should be benefited in the same way that the other data center REITs are.
So where is the fundamental damage?
We don't see much damage from the current environment and believe the 26% drop was unwarranted. IRM has full access to the external growth of data center REITs through an ample development and acquisition pipeline. It is a similarly growthy REIT that just happens to be trading at about half the multiple of the other DC REITs.
Where else can one get a 10.5% dividend yield and full exposure to a data center pipeline?

For a full toolkit on building a growing stream of dividend income, please consider joining Retirement Income Solutions. As a member you will get:
- Access to Two Real Money REIT Portfolios
- Real-Time Trade Alerts
- Continuous market commentary
- Data sets on every REIT
You will benefit from our team's decades of collective experience in REIT investing. On Retirement Income Solutions, we don't only share our ideas, we also discuss best trading practices and offer members a chance to participate and grow.
We welcome you to test it out with a free 14-day trial. Lock in our founding member rate of $240 before it expires!