It is no secret that gold miners ETF (NYSEARCA:GDX) has tremendously underperformed the precious metal itself (GLD) since the secular bull market in gold ended back in 2012. Indeed, GDX is trading at almost half its value from its peak of above $60 despite GLD being just -12% from its all-time highs.
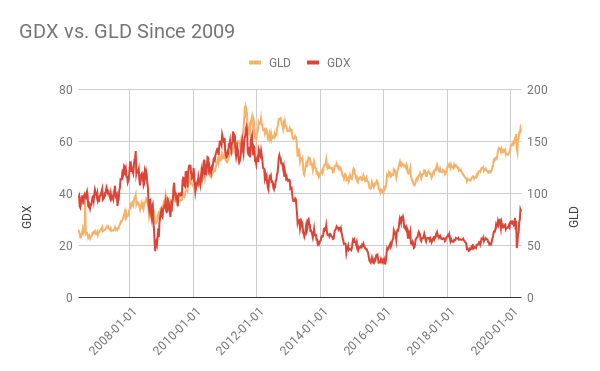
Source: WingCapital Investments
That said, there is light at the end of the tunnel after GDX mounted a V-shape recovery off the panic-selling lows just under $20 to break above its 5-year consolidation. The GDX/GLD ratio, a measure of relative performance between gold miners and gold, has likewise stabilized and turned the corner based on the observation that its 200-week moving average has finally started rising after years in a persistent downtrend.
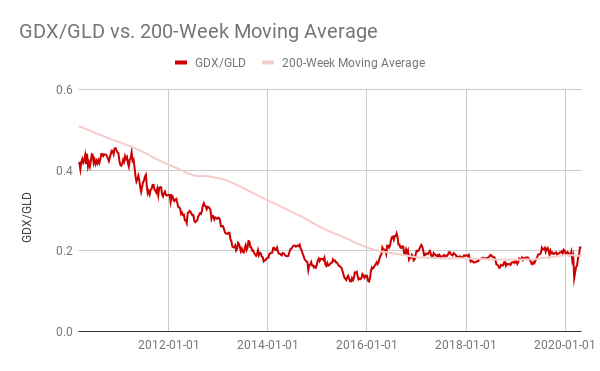
Source: WingCapital Investments
Top Holdings' Fundamentals On The Mend
It is without a doubt that no gold miners are created equal, and the underlying holdings of GDX make a great example. The 10-year performance comparison between the 3 largest names in Newport Mining Corp (16% weight) (NEM), Barrick Gold Corp (15% weight) (GOLD) and Franco-Nevada Corp (8%) (FNV) speaks a thousand words:
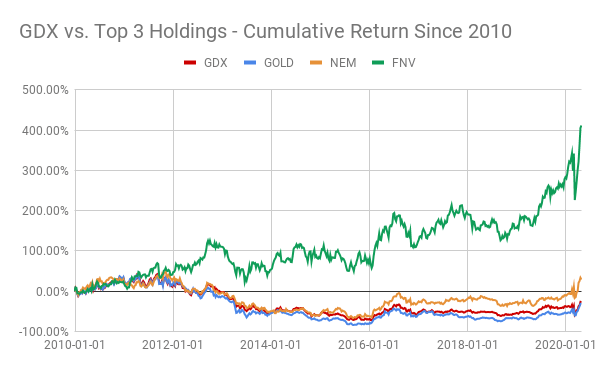
Source: WingCapital Investments
As illustrated above, despite the spectacular gains in FNV, as well as NEM returning to its all-time highs, GDX's performance trajectory instead mirrors that of Barrick Gold Corp, which has mired in a decade-long bear market. Indeed, the vast differences in their earnings picture, as witnessed in their EBITDA growth over the past 5-10 years, help explain the bifurcation in their performance:
GDX Top 10 Holdings - EBITDA Per Share Since 2010
| Symbol | Name | % Weight | 2010 EBITDA / Share | 2015 EBITDA / Share | 2018 EBITDA / Share | TTM EBITDA / Share | 10-Year Chg | 5-Year Chg | 1-Year Chg |
| NEM | Newmont Corp | 15.77% | 10.35 | 3.94 | 5.16 | 5.16 | -50.12% | 30.97% | -0.01% |