Being a value investor has been quite a challenge over the past few years. I have felt it personally when comparing my “best on best” – Farmer Mac, my best long idea, and Redfin, my favorite short. This chart shows that Redfin’s stock recently hit a record high, while Farmer Mac is down about 30% from its peak.
Source: Yahoo Finance
And here is the earnings comparison between the two companies:
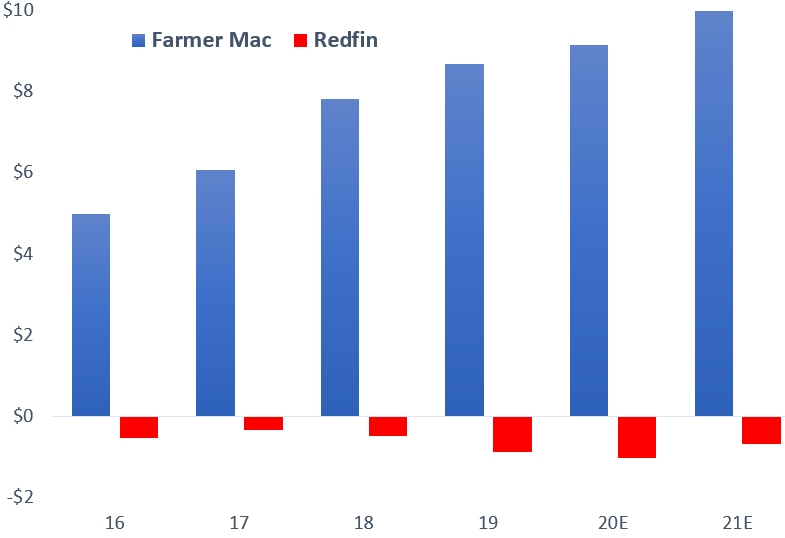
Sources: Company reports, Yahoo Finance, Gary Gordon (My estimates for Farmer Mac for 2020 and 2021, my adjustment of Redfin EPS to operating earnings.
How does Farmer Mac’s stock decline while its EPS steadily rises, and Redfin’s stock rise while mired in steady losses? The stock prices clearly imply that the fortunes of these two companies will seriously reverse. This article addresses that possibility. It builds on my two prior Seeking Alpha articles on Farmer Mac – 1 and 2 – and my two on Redfin – 1 and 2. The first ones lay out my investment themes, the second are follow-ups.
I first lay out the operating stories for both companies. Then I present some valuation scenarios. I conclude that there is nearly no scenario that makes Redfin anywhere near as valuable as Farmer Mac.
Market share. Farmer Mac makes mortgage loans to, well, farmers, plus select other rural businesses. Farmer Mac estimates that its addressable market at present is $246 billion of farm mortgage and related loans. With $16 billion in loans, Farmer Mac has a 6.5% market share. Its competitors are primarily banks (mostly small rural banks), the Farm Credit System and insurance companies.
Revenue growth. Farmer Mac averaged 11% revenue growth from 2013 to 2019. Not too shabby. So it is clearly taking market share.
Profit margins. As capital-intensive businesses, lender profit margins are best measured by return on equity. Farmer Mac’s ROE has consistently been around 17%, which is at the upper end of the range for financial companies. So Farmer Mac is growing market share while staying consistently very profitable.
Risks. Lenders manage two critical risks – credit risk and interest rate risk. Farmer Mac has excelled at both. Here is the average chargeoff rate (loan losses divided by the loan portfolio) for Farmer Mac and peers over the past two decades:
Farmer Mac’s loss rate might literally be the lowest in the U.S. lending business. And here is a history of Farmer Mac’s interest spread – the difference in yield between its assets and liabilities:
Source: Farmer Mac
Farmer Mac’s interest spread is far lower than bank JP Morgan and MBS investor AGNC, but it has been far more stable. And Farmer Mac’s ROE has been superior to both these peers – over the past five years, 17% for Farmer Mac, 12% for JP Morgan and 6% for AGNC. That is because its low risk assets allow it to leverage far more on investors’ capital.
Competitive advantages. Farmer Mac has two big and durable competitive advantages. One is an implied guarantee of its debt by the federal government. This benefit allows it to borrow very cheaply. The company can therefore afford to hedge its interest rate risk and maintain high credit standards, and still earn a high ROE.
The other competitive advantage is the fact that farmers are a protected class. The federal government maintains several subsidies to support farmers’ incomes, and has done so for many decades. This fact has never been clearer over the past two years. First, a trade war threatened farm product sales to China. Second, the pandemic dampened both restaurant demand and meat supply (slaughterhouse issues). In both cases, new subsidies were quickly granted to offset farm revenue losses.
Market share. Redfin is a realtor. Its addressable market is about $2 trillion a year of home sales, which generates about $80 billion of real estate commissions. Redfin carefully tracks its market share, which was 93 bp during Q1, more than double its 2015 share.
Revenue growth. With the sharp rise in market share has come strong revenue growth, an average of 29% a year from ’15 to ’19. Q1 revenue growth maintained that pace, at 26%. Pretty awesome.
Profit margins. Three margins are of interest. The first is the average commission Redfin earns on home sales. The industry generally charges 3% for a sale or a buy. Redfin has averaged 2% since 2015, with a slight downward bias. That certainly explains the market share and revenue gains – Redfin heavily discounts its service.
The other two profit measures of importance are gross and net profit. For gross profit I include direct expenses (mostly sales agent pay) and marketing spend. Net profit adds tech and admin expenses. Here are the numbers since 2015:
Sources: Redfin financial statements
The chart shows that Redfin peaked at a 20% gross margin in 2016, but it drifted down to about 15% last year. And the net margin? Consistently in the red (my choice of color here was not accidental!), with a down arrow over the past two years.
Note that I ignore Redfin’s home flipping and title/mortgage origination businesses in my analysis. As I argue in my initial report, I see little prospect of them adding material value. They are losing a bit of money at present.
Risks. I see two notable risks. One is the industry risk of a sustained decline in home sales, especially since Redfin now carries an inventory of homes owned. Unless the U.S. economy falls into a depression, that isn’t a material risk. The other is that Redfin has been burning some cash because of operating losses and home purchases. But the company raised new capital recently.
Competitive advantages. Redfin has significantly grown its market share of homes sold, so it must have a competitive advantage, right? I strongly disagree. Gaining share by charging money-losing prices is not a competitive advantage. The other proposed advantage is technology. Redfin has spent a fair amount on technology. But it has yet to prove that the new services it is offering can gain business at a profit.
We own shares of companies to gain access to their earnings, however far in the future we are willing to look. So let’s compare earnings estimates for Farmer Mac and Redfin and present value them to today. Here are my assumptions:
Valuation tranche #1: ’20-‘24
Here are my calculations:
For Farmer Mac, this model tells me that $38 of its current value is explained by the next five years of EPS, meaning that only $22 is at risk to EPS results beyond 2024. For Redfin, the next five years actually generate a small loss in value, meaning that its entire current value relies on EPS beyond 2024.
Valuation tranche #1: ’25-‘30
Again my numbers:
For Farmer Mac, the six years ’25-’30 generate another $38 in present value for investors. Investors are therefore well more than paid back for today’s required $61 purchase price. For Redfin, the years ’24-’30 generate $8 in value. Today’s $39 investment, therefore, contains $31 in value beyond 2030!
One more fun comparison. Focus for a second on the year 2030 in the above table. Farmer Mac is earning $16 a share, Redfin $5. I not only have to be wrong in this analysis but massively wrong.
I am comfortably long Farmer Mac and short Redfin.
This article was written by
Disclosure: I am/we are long AGM. I wrote this article myself, and it expresses my own opinions. I am not receiving compensation for it (other than from Seeking Alpha). I have no business relationship with any company whose stock is mentioned in this article.
Additional disclosure: I am short RDFN