
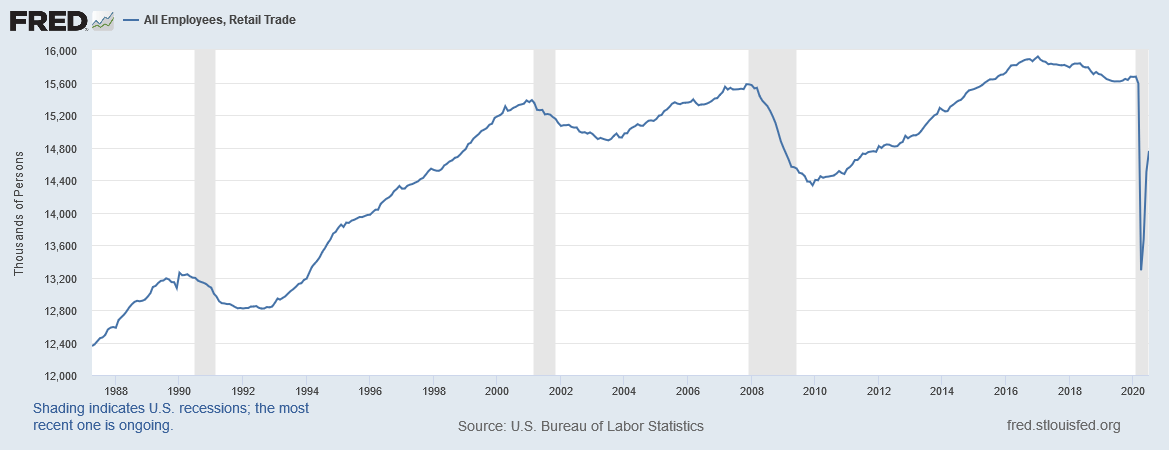
Have we reached peak retail services employment? The following graph shows the total number of retail employees going back to the late 1980s:
Consider the following points:
- The size of the peak in each cycle has been increasing. It was 15.4 million in 2001, 15.6 million in 2008, and 15.9 million in 2020. But the peaks in the last two cycles are very close to one another.
- During the last 20 years, brick-and-mortar stores have faced increasing competition from online providers, which is a trend that will continue.
- There have been 25 major retail bankruptcy announcements during the last 3-4 months, which will likely continue.
- About 2.4 million retail jobs were lost due to the lockdowns; about 1.5 million have been reinstated.
It's doubtful we'll return to the 15.9 million level soon, if ever.
So long as we're looking at data, consider this chart of capacity utilization: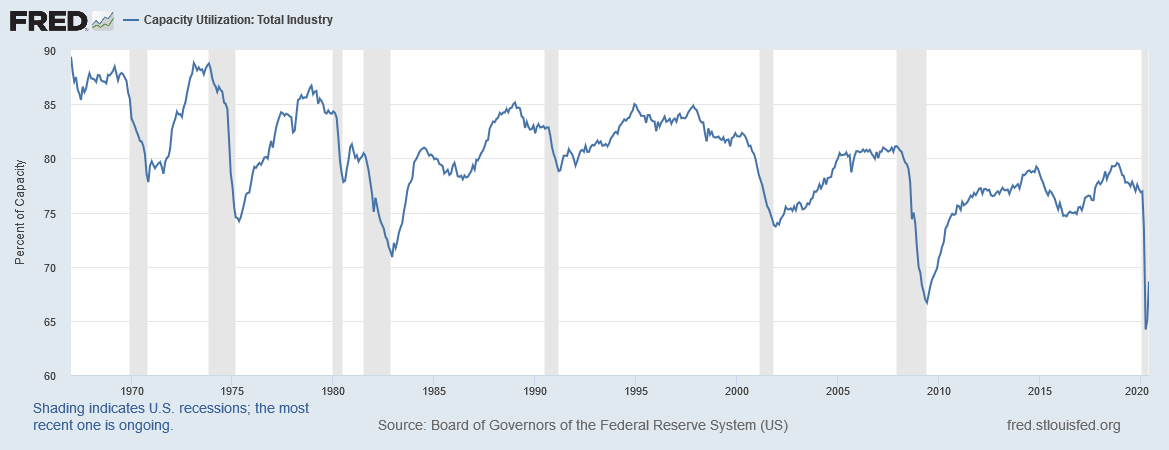
It has hit progressively lower peaks since the 1980s and dropped sharply as a result of the lockdowns. With utilization, it's unlikely we'll see a torrent of new equipment orders, which means we'll see weaker growth in capital goods orders for the intermediate time frame. This is a key leading economic indicator. In other words, this does not bode well for the near and intermediate term.
The Fed releases industrial production tomorrow.
The labor data is moving in the right direction but it's still incredibly ugly (emphasis added):
In the week ending August 8, the advance figure for seasonally adjusted initial claims was 963,000, a decrease of 228,000 from the previous week's revised level. The previous week's level was revised up by 5,000 from 1,186,000 to 1,191,000. The 4-week moving average was 1,252,750, a decrease of 86,250 from the previous week's revised average. The previous week's average was revised up by 1,250