 My Friday column is divided into two sections. The first uses the analytical methodology developed by Arthur Burns and Geoffrey Moore, which classifies economic data as either a long-leading (it turns 12-18 months before a recession), leading (it turns 3-12 months before a recession), or coincidental (it turns more or less at the same time as the economy). The second section looks at ETFs which track the major averages.
Long-leading indicators
Thanks to efforts by the Fed, there is amply liquidity in the economy: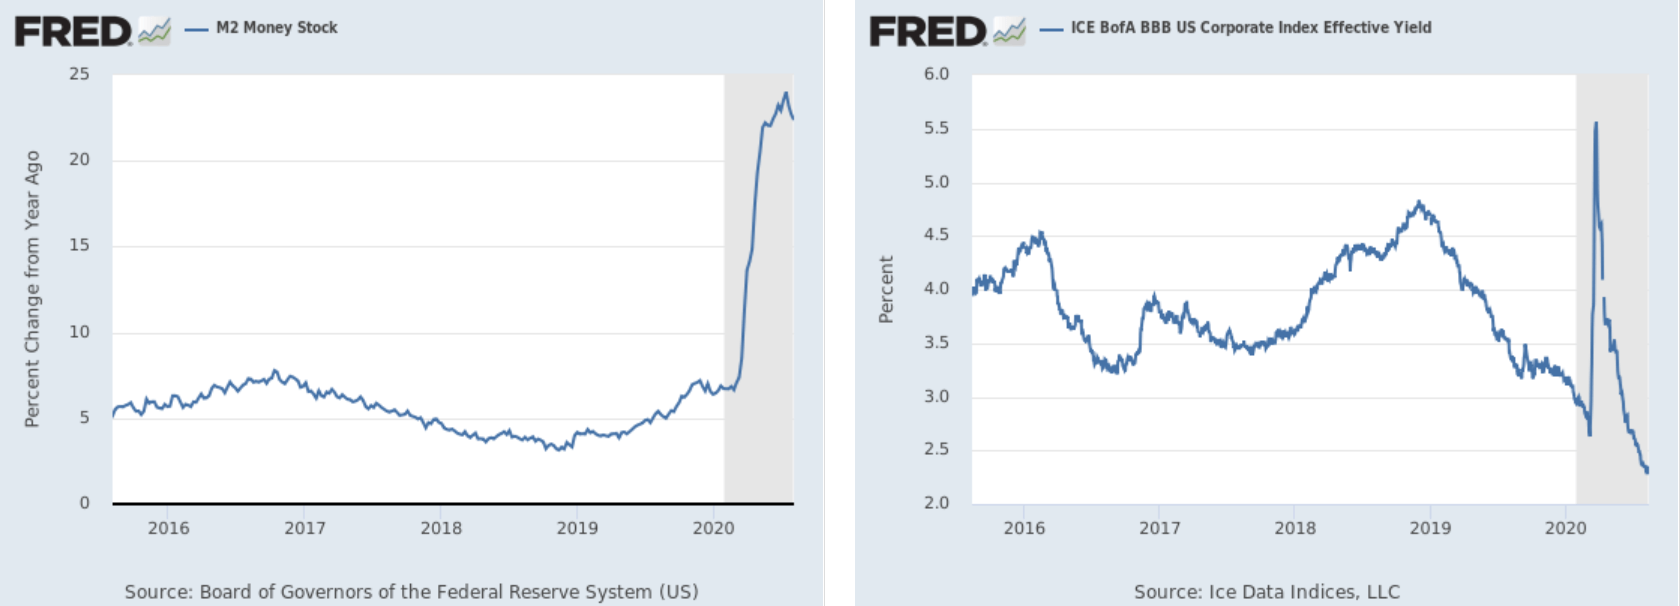 The Fed has pumped up the money supply (left chart) to very high levels. And, its efforts to backstop the credit markets have helped to lower yields to very low levels (right chart).
Corporate earnings, however, are another matter. From Zacks (emphasis added):
Total earnings for the 455 S&P 500 members that have reported Q2 results already are down -35.5% on -11.3% lower revenues, with 79.6% beating EPS estimates and 62.6% beating revenue estimates.
This is the lowest earnings growth pace since the last earnings downturn following the 2008 recession, but the proportion of these companies beating consensus estimates, particularly EPS estimates, is tracking above historical trends.
This shouldn't be surprising considering the economic lockdown that occurred in the Spring.
Leading Indicators
Most of this data has "turned the corner:"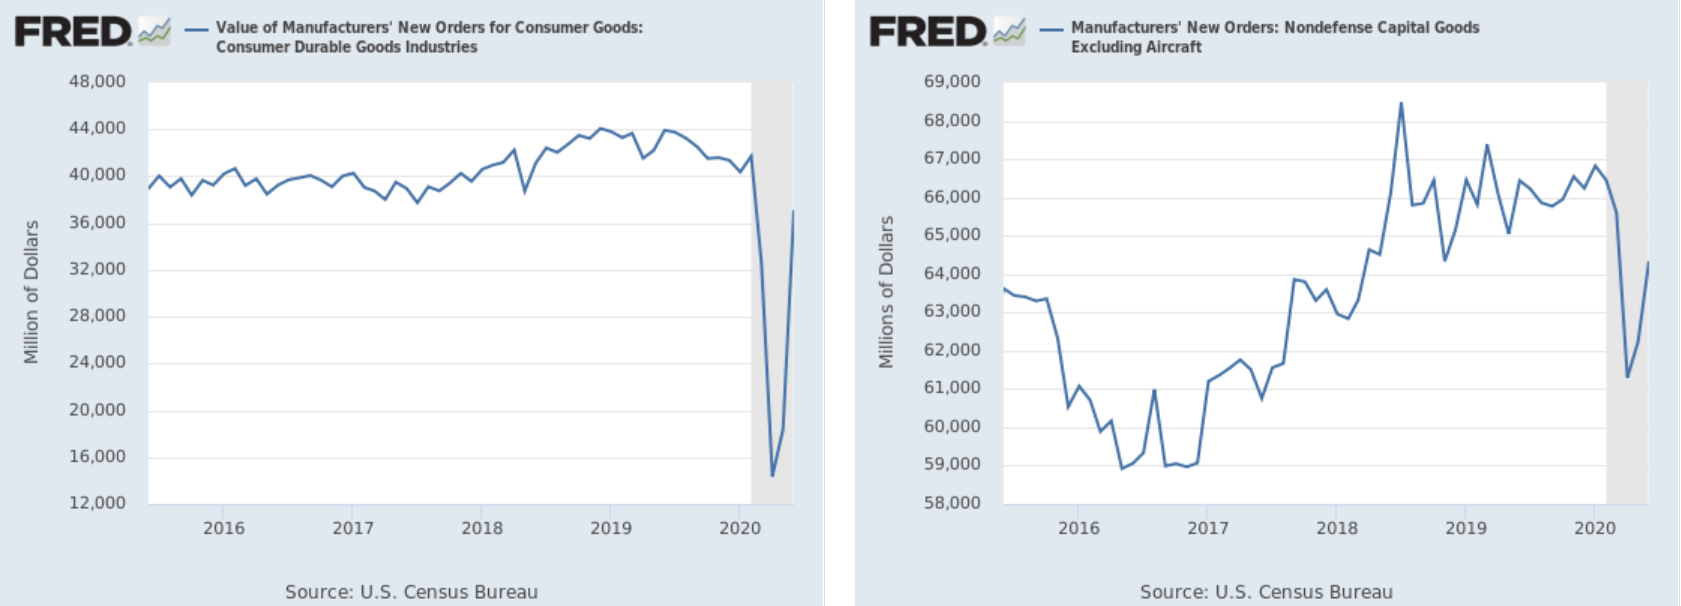 New orders for consumer durable goods (left) and nondefense capital goods (right) have rebounded. Consumer goods orders are close to reaching previous levels; capital goods have regained about 50% of their losses.
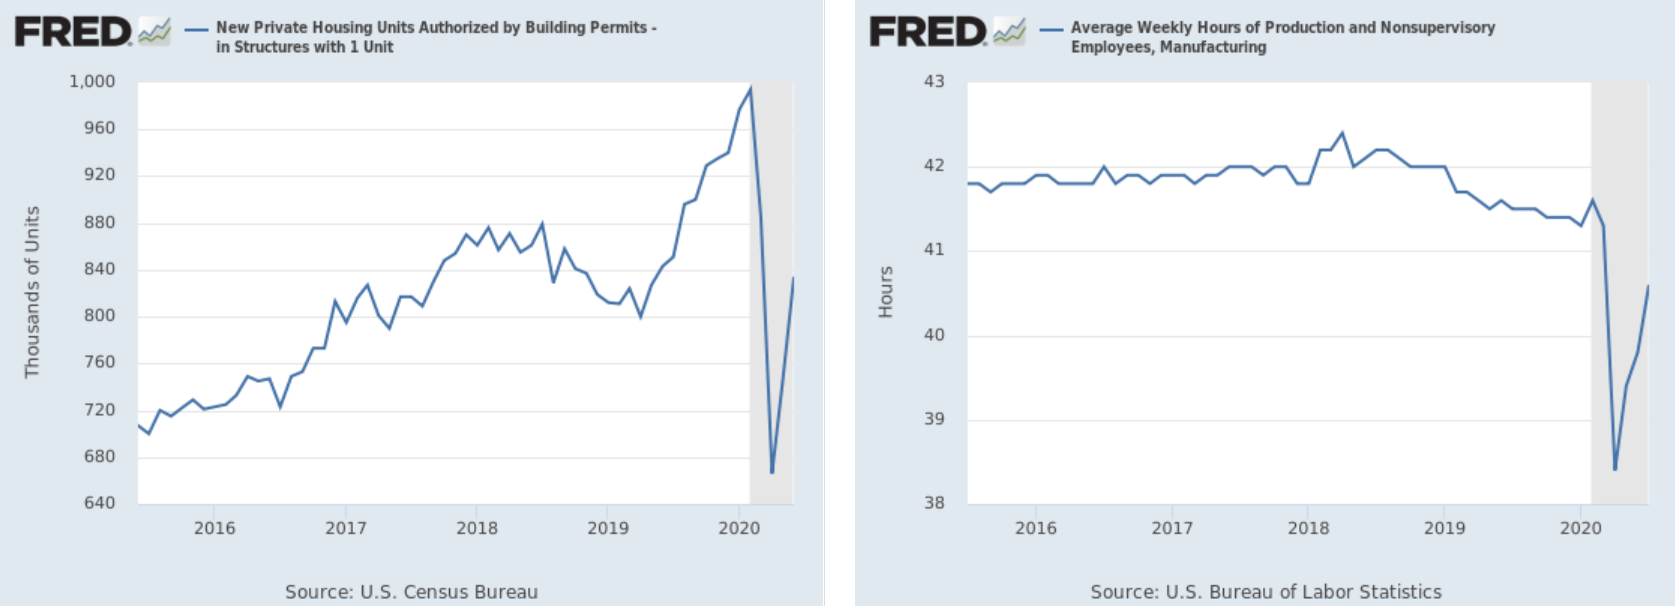 Building permits (left) have rebounded as well, as have the weekly hours worked by non-supervisory employees.
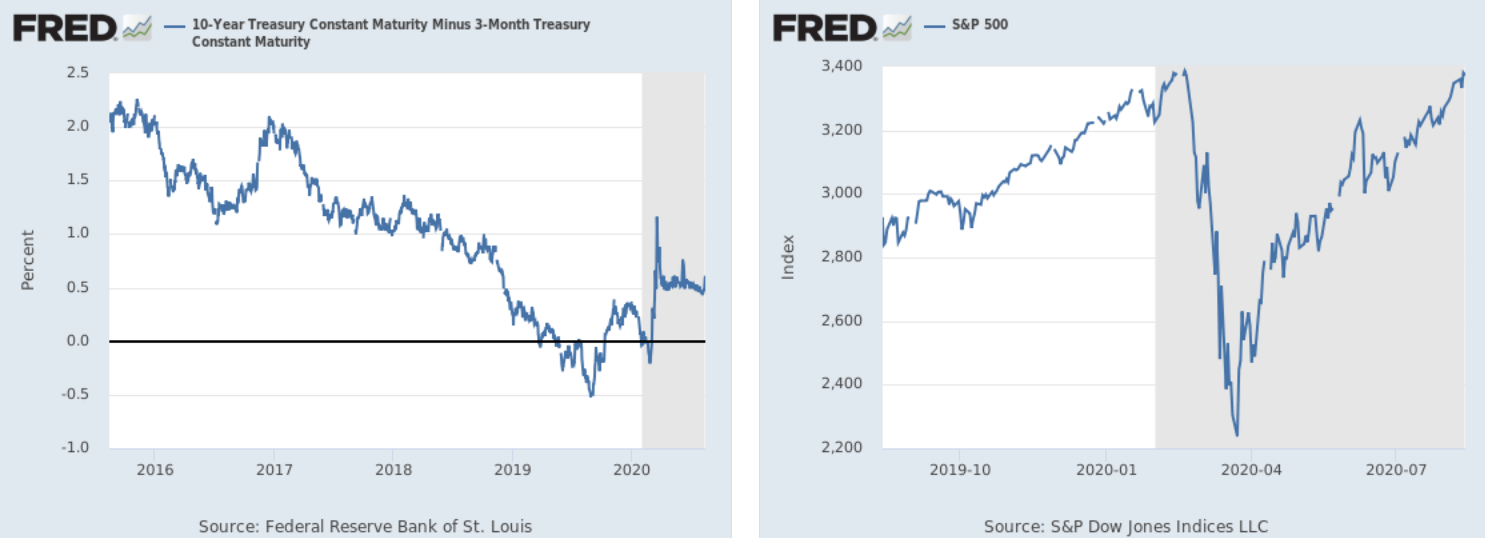 The yield curve has returned to a positive slope (left chart) while the stock market is back near all-time highs (right chart).
The biggest problem is still the labor market: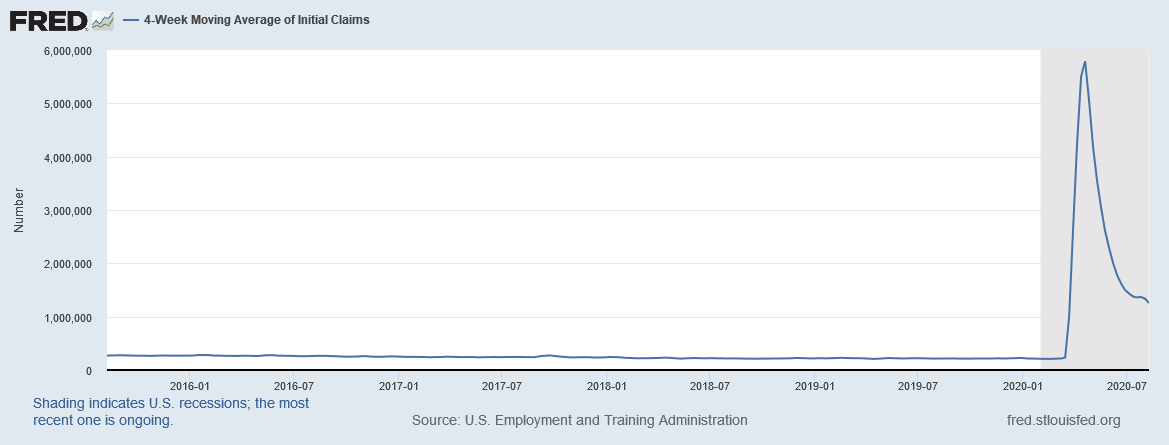 The 4-week moving average of initial unemployment claims is still