McCormick & Company (NYSE:MKC) is the largest player in the spice and flavorings sector, commanding ~20% market share. Roughly 80% of sales come from the consumer side, with the remaining 20% coming from the food service segment. The consumer side has seen a big boost due to the COVID-19 and the stay-at-home trend, and the share price has benefited greatly since the March lows.
Dividend History
For the core of my portfolio, I want to invest in quality businesses that have proven themselves over time. Often, a quick screen for that is the dividend history that company has amassed. A lengthy streak of growing dividends can help weed out the investment opportunities and help you narrow your focus.
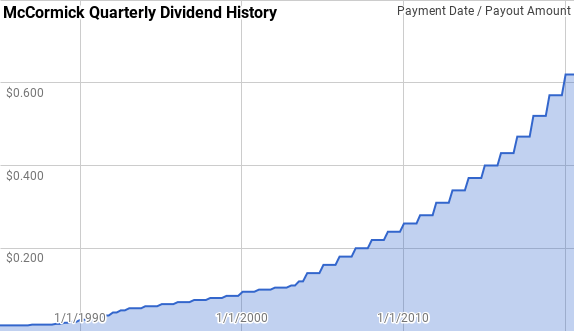
Image by author; data source McCormick & Company Investor Relations
According to the CCC list, McCormick is a Dividend Champion with 33 consecutive years of dividend increases. The dividend growth streak dates back to 1987.
During McCormick's streak, year-over-year dividend growth has ranged from 5.0% to 35.7%, with an average of 12.1% and a median of 9.4%.
The rolling 5-year dividend growth rates during the company's streak have ranged from 7.0% to 237.1%, with an average of 11.9% and a median of 9.2%. The rolling 10-year dividend growth rates have ranged from 7.7% to 17.7%, with an average of 11.0% and a median of 10.3%.
Historically, McCormick has been a fantastic dividend grower. The rolling 1-, 3-, 5- and 10-year dividend growth rates since 1985 can be found in the following table.
| Year | Annual Dividend | 1-Year | 3-Year | 5-Year | 10-Year |
| 1985 | $0.0550 | ||||
| 1986 | $0.0550 | 0.00% | |||
| 1987 | $0.0625 | 13.64% | |||
| 1988 | $0.0663 | 6.00% | |||
| 1989 | $0.0850 | 28.30% | 15.62% | ||
| 1990 | $0.1150 | 35.29% | 22.54% | ||
| 1991 | $0.1400 | 21.74% | 28.33% | 20.55% | |
| 1992 | $0.1900 | 35.71% | 30.75% | 24.90% | |
| 1993 | $0.2200 | 15.79% | 24.14% | 27.13% |