This article was coproduced by Williams Equity Research ("WER").
At iREIT on Alpha, we cover a broad range of real estate investment trusts. This includes more than 150 U.S. equity REITs and 14 commercial mortgage ones.
Excluding Hannon Armstrong (HASI), the mREITs below have returned an average of -39.5% year-to-date:
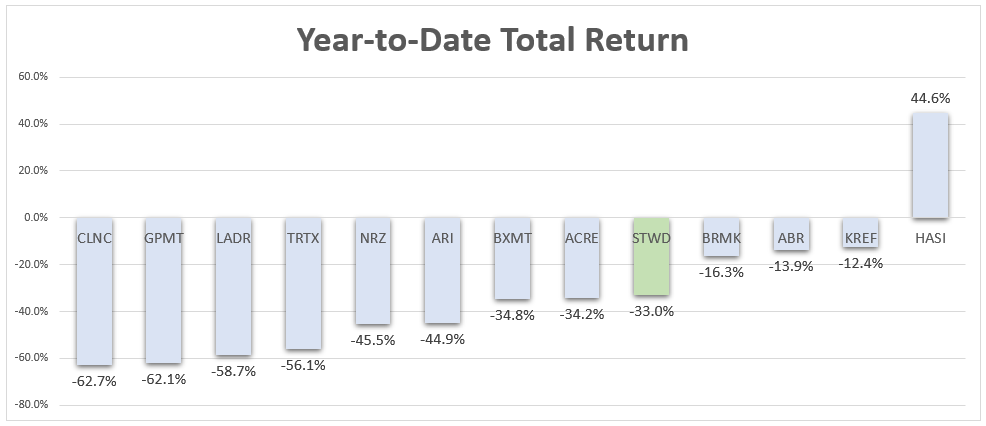
(Source: Wide Moat Research)
Though here's a snapshot of the sector's performance during the last 30 days:
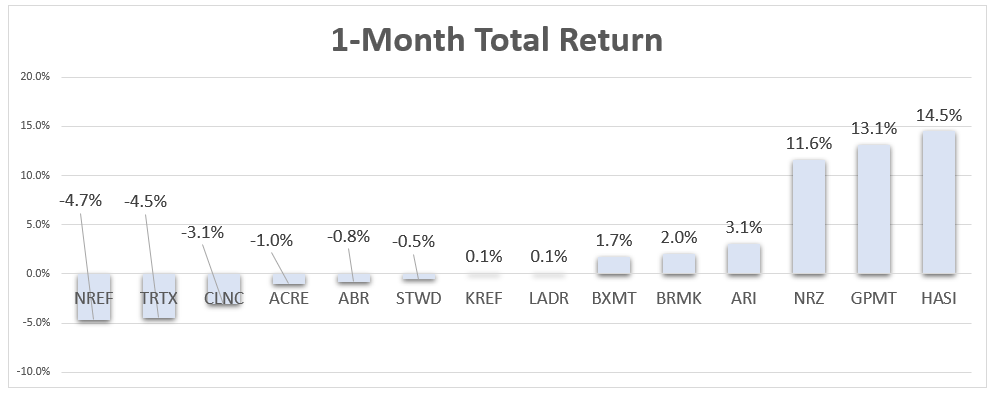
(Source: Wide Moat Research)
That’s part of the reason why we decided to take a closer look today at Starwood Property Trust (NYSE:STWD). It’s a popular name that now commands one of the highest dividend yields in its history, at 13.7%.
So what do we make of it?

(Source)
It's Been A Long and Interesting Year (to Say the Least)
Starwood reports Q3 earnings early on Nov. 5, and it should be interesting.
It released its Q1 data in April and May, back when coronavirus assumptions were at their low point across the board. Instead of lightening up, lockdowns were tightening. And initial mortality estimates were intensely grim, leaving the investor population to worry about:
- How deep the weakness at the tail end of Q1 would affect the whole quarter
- Managements’ full-year expectations (unfortunately for us, most withdrew guidance)
Yet we somehow had even less clarity on the depth, duration, and impact of the lockdowns afterward. On the one hand, independent observers began to question the original apocalyptic predictions. On the other, so many places were still locked down to some degree or another, hampering any recovery.
Now in the middle of Q3 earnings season, the market was only a few percentage points off its cyclical highs. Technology companies are up 24% this year. And while the steep divide between growth and value has begun to narrow, the latter remains seriously out of favor.
Join the iREIT Revolution! (2-Week FREE Trial)
At iREIT, we're committed to assisting investors navigate the REIT sector. As part of this commitment, we recently launched our newest quality scoring tool called iREIT IQ. This automated model can be used for comparing the "moats" for over 150 equity REITs and screening based upon all traditional valuation metrics.
Join iREIT NOW and get 10% off and get Brad's book for FREE!

* Listen to our Ground Up Podcast * 2-week free trial * free REIT book *