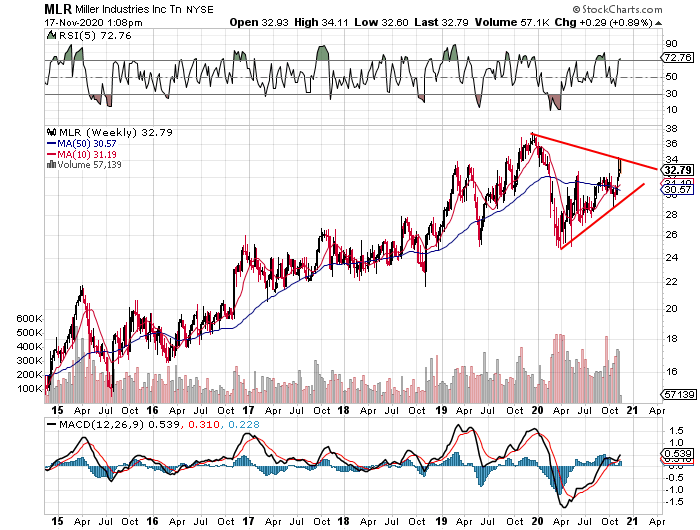
Miller Industries (NYSE:MLR) has been on a multi-year bull run since the Great Recession. At present, a symmetrical triangle seems to be playing itself out which more often than not ends up as a continuation pattern. As we can see from the chart below, shares came back down earlier this year to successfully test the 2019 lows. This was an excellent buying opportunity as illustrated by the crossover on the MACD indicator. Symmetrical triangles normally represent a pause in the prior trend. However, buying volume has been light lately which means a breakout may not be at hand in the near term.
Being chartists, we believe that any fundamental which could possibly affect the share price's trajectory has already been embedded in the technical chart. However, when we have two conflicting signals (continuation pattern and decreasing buying volume), we like to go to the financials to get a read on where we believe shares are headed.
To give some background before we dig into the balance sheet, Miller Industries announced its third-quarter earnings at the start of this month. Although the company witnessed growth on a sequential basis, it still saw top and bottom declines compared to the third quarter of 12 months prior. Sales ($168.4 million) dropped by almost 14% and net profit ($6.6 million) declined by over 18% in the quarter.
One quarter as we know, though, does not make or break a company. Many companies much stronger than Miller Industries have suffered rolling year losses this year. The issue for us (when researching the financials of the firm) is to try and spot trends which are either bullish or bearish for the firm. Trends in key metrics on the balance sheet which run over the past 8 quarters should give us a good indication on whether we will get a breakout to that above-mentioned
----------------------
Elevation Code's blueprint is simple. To relentlessly be on the hunt for attractive setups through value plays, swing plays or volatility plays. Trading a wide range of strategies gives us massive diversification, which is key. We started with $100k. The portfolio will not not stop until it reaches $1 million.
-----------------------