Outfront Media: Set To Grow Post-COVID, Shares Are A Buy

Nov. 25, 2020 11:10 PM ETOUTFRONT Media Inc. (OUT) StockOUT7 Comments

Summary

  • Outfront Media has seen a sequential improvement in its operating metrics in the latest quarter, and has returned to profitability.
  • Increased urbanization post-COVID should help the company return to growth mode.
  • The pandemic won't last forever, especially given the recent positive vaccine news. Shares are a buy for long-term investors.

Outfront Media’s (NYSE:OUT) stock has been a solid performer since the depths of the pandemic. I last visited the stock on July 21st, and had a bullish stance on it. Since then, the stock has posted a 32% return (as of writing), far outpacing the 11% return of the S&P 500 (SPY) over the same timeframe. Given the recent positive news on the vaccine, I remain optimistic on the company. In this article, I show what makes Outfront Media a worthy buy for long-term investors, so let’s get started.

(Source: Company website)

A Look Into Outfront Media

Outfront Media is an outdoor advertising company with 512K total displays in prime locations spread across North America. Its corporate model is governed by what it calls “TLC,” which stands for technology, location, and creativity. In 2019, its media displays reached 7 out of 10 Americans per week, equating to 16.6 billion weekly impressions across 70+ U.S. markets, and it’s likely that you have seen one of its billboards on your daily commute. Last year, Outfront generated nearly $1.8 billion in total revenue.

As one would expect, Outfront Media’s business has taken a significant hit this year due to decreased consumer mobility during this pandemic. This continues to be reflected in the latest quarter’s results, with revenue declining by 39% YoY, from $462.5M in Q3’19, to $282.3M in Q3’20. AFFO/share had a sharper 70% YoY decline, to $0.19 per share in the latest quarter. That’s because Outfront has to maintain a certain level of operating expense (maintenance & SG&A) that cannot be dialed down at the same rate as the decline of revenue.

As seen in the YoY AFFO bridge below, the decline in adjusted OIBDA (operating income before depreciation and amortization) was partially offset by improvements on the expense side.
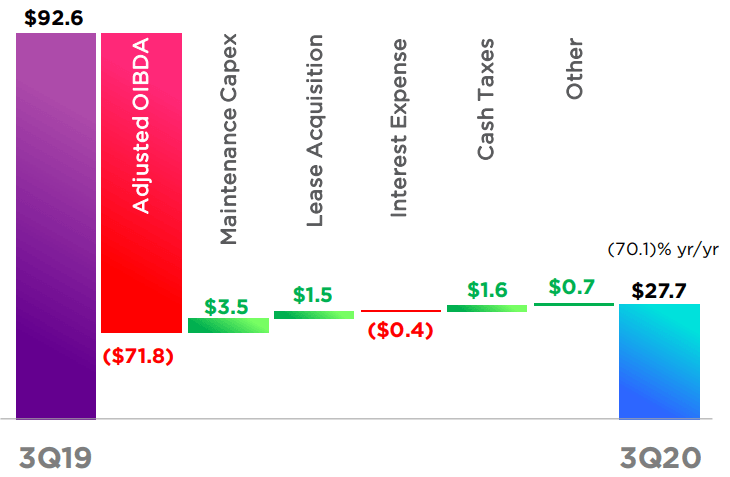
(Source: Q3’20

This article was written by

21.46K Followers

I am Gen Alpha. I have more than 14 years of investment experience, and an MBA in Finance. I focus on stocks that are more defensive in nature, with a medium- to long-term horizon.

I provide high-yield, dividend growth investment ideas in the investing group

iREIT®+HOYA Capital

. The group helps investors achieve dependable monthly income, portfolio diversification, and inflation hedging. It provides investment research on REITs, ETFs, closed-end funds, preferreds, and dividend champions across asset classes. It offers income-focused portfolios targeting dividend yields up to 10%.

Learn more

.

Analyst’s Disclosure:I/we have no positions in any stocks mentioned, and no plans to initiate any positions within the next 72 hours. I wrote this article myself, and it expresses my own opinions. I am not receiving compensation for it (other than from Seeking Alpha). I have no business relationship with any company whose stock is mentioned in this article.

This article is for informational purposes and does not constitute as financial advice. Readers are encouraged and expected to perform due diligence and draw their own conclusions prior to making any investment decisions.

Seeking Alpha's Disclosure: Past performance is no guarantee of future results. No recommendation or advice is being given as to whether any investment is suitable for a particular investor. Any views or opinions expressed above may not reflect those of Seeking Alpha as a whole. Seeking Alpha is not a licensed securities dealer, broker or US investment adviser or investment bank. Our analysts are third party authors that include both professional investors and individual investors who may not be licensed or certified by any institute or regulatory body.

Recommended For You

About OUT Stock

SymbolLast Price% Chg
EPS
PE
Div Rate
Yield
Short Interest
Market Cap
Volume
Compare to Peers

More on OUT

Related Stocks

SymbolLast Price% Chg
OUT
--