Much like the rest of the healthcare sector, Novartis (NVS) pulled back approximately 30% in early 2020. However, since March, the healthcare sector, as measured by XLV, rallied 55% to its recent highs whereas the NVS has only rallied 34% off its 2020 low. Furthermore XLV exceeded its all-time highs in July, but NVS is still consolidating below its 2020 high which it has yet to exceed
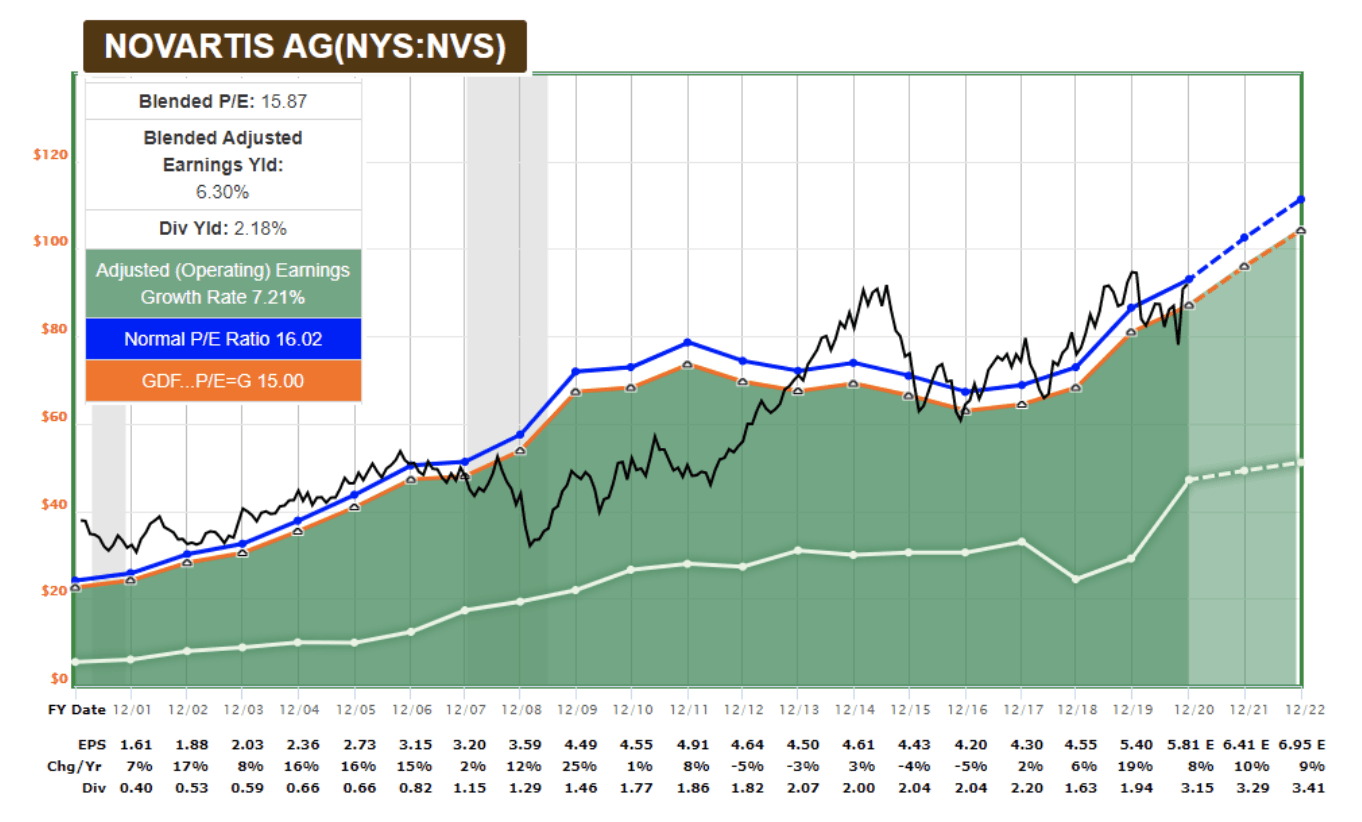
Fundamentally, Lyn Alden sees NVS within reasonable valuation as demonstrated by the accompanying FAST Graph. In a recent Stockwaves post, Lyn wrote “NVS and a number of other healthcare stocks remain relatively attractive as long-term holders and dividend payers.”
From a technical perspective, even though NVS has underperformed relative to other stocks in the healthcare space, we see a very bullish pattern taking shape which supports a rally thesis in NVS and portends this stock “catching up” strongly in 2021.
The rally from the March low into the April high counts very nicely as a 5 wave move with proportions that are nicely characteristic of an Elliott Wave “impulse.” Since the mid April high, price action has been rangebound and corrective, ultimately striking a significant low on Oct. 30 at a level which almost perfectly coincides with the 61.8% retrace of the initial impulse off the March low. The 61.8% retrace is a significant level in our study of fibonacci pinball as it represents the lower end of our standard support region for a second wave. Since the Oct. 30 low, Novartis rallied 20% and has formed another impulsive structure with the standard proportions for wave i of 3 within our fibonacci pinball framework. As of Monday 12/21 price has started to pull back in wave ii of 3. In Elliott Wave analysis we note that the most powerful moves in the market tend to emerge from 1-2, i-ii setups, which is exactly what has formed in Novartis.
STOCK WAVES: Where fundamental analysis meets technical analysis for highest-probability investment opportunities!
"Thus far, the best stock-picking service I've seen--and I've been doing this for 35+ years! (Gunfighter)
"Stock Waves has produced more gains in the past month(+) than many sites do in years or decades." (Keto)
"The amount of trades I've been able to take resulting in 100%+ returns is nothing short of amazing. If you do not have Stockwaves, you are only doing yourself a disservice." (dgriff617)
Click here for a FREE TRIAL.