This dividend ETF review series aims at evaluating products regarding the relative past performance of their strategies and quality metrics of their current portfolios.
OUSA strategy and performance
The O’Shares FTSE U.S. Quality Dividend ETF (BATS:OUSA) tracks the O’Shares U.S. Quality Dividend Index, which is a strategy following systematic rules. Distributions are monthly, the annualized SEC yield of OUSA is currently 1.83% and the weighted average yield of holdings is 2.34%. It's quite low for a dividend ETF, but consistent with this kind of strategy: Most dividend-growth and quality-focused equity dividend ETFs have a dividend yield between 1.5% and 3%. The expense ratio is 0.48%.
As described on O’Shares website, the target index was changed six months ago: “The new index provides greater emphasis on our principles of Quality. Information beginning June 1, 2020, including yield and holdings data, reflect the index change.”
OUSA invests in “large-capitalization and mid-capitalization dividend-paying issuers in the United States that meet certain market capitalization, liquidity, high quality, low volatility and dividend yield thresholds (...). The high quality and low volatility requirements are designed to reduce exposure to high dividend equities that have experienced large price declines.”
Since inception (07/14/2015), OUSA has underperformed the S&P 500 index (SPY) in total return. It shows a lower risk measured in standard deviation of monthly return (“volatility”).
Total Return | Annual.Return | Drawdown | Sharpe ratio | Volatility | |
OUSA | 73.64% | 10.58% | -31.40% | 0.74 | 13.65% |
SPY | 101.32% | 13.59% | -32.05% | 0.81 | 15.63% |
The next chart plots the equity value of $100 invested in OUSA and SPY since OUSA inception.
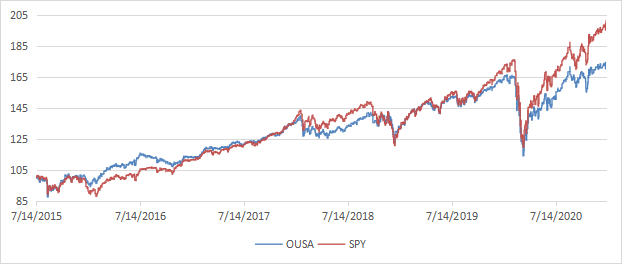
OUSA was on par with SPY until Q3 2019, then underperformed it in a market mostly powered by big tech companies (reminder: The underlying index has changed in June 2020).
Comparing OUSA with simple strategies
In previous articles, I have shown how
QRV Stability is a portfolio of dividend stocks designed to outperform its benchmark and equity dividend ETFs. Quantitative Risk & Value (QRV) provides you with a toolbox and educational content to implement data-driven strategies and monitor market risks. Get started with a two-week free trial and see how QRV can improve your investing decisions. 