Cboe Global Markets: A High Margin Intermediary

Passive Income Pursuit
4.33K Followers

Summary

  • Cboe Global Markets is a Dividend Contender with 11 consecutive years of dividend growth. Shares currently yield 1.70%.
  • Cboe Global Markets generates plenty of free cash flow to fuel organic growth and growth through acquisitions.
  • Expansion and development of the European derivatives market is the next growth market that management is tapping into.
  • CBOE is priced to deliver >10% returns.

CBOE Global Market Dividend Stock AnalysisImage Source

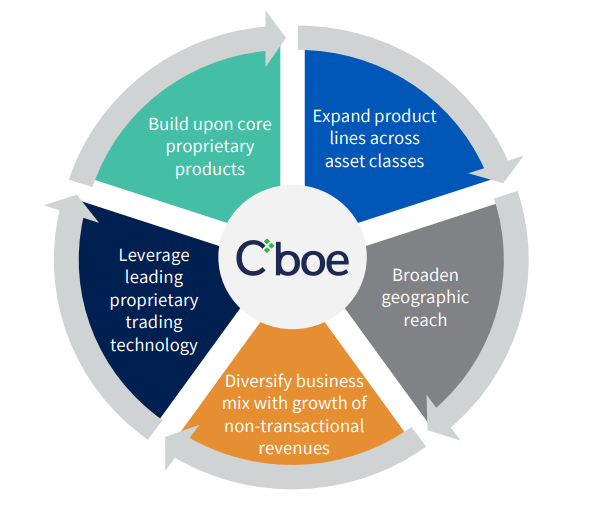
Cboe Global Markets (BATS:CBOE) is a financial marketplace offering trading capabilities including options, foreign exchange, futures, U.S. and European equities and various volatility products. The CBOE Volatility Index, VIX, is the most commonly referenced product in regards to volatility of the domestic equity market.

Dividend History

The investment strategy that I gravitated towards most when I began investing on my own was dividend growth investing. In practice, dividend growth investing is about identifying companies that are built to last and that have a management team that is willing to share cash flow via dividends. It's akin to the aphorism of "a bird in the hand is worth two in the bush" with a preference of receiving some of my returns now as opposed to an implied promise to receive them in the future.

CBOE Dividend History
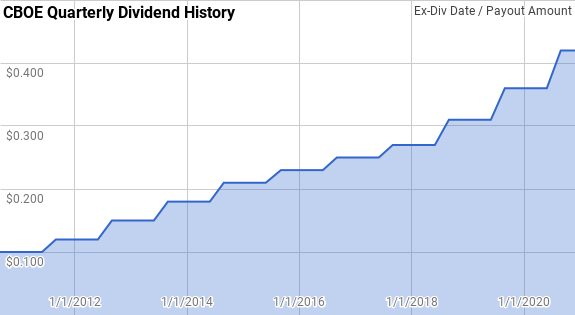
Image by author; data source Cboe Global Markets Investor Relations

CBOE is a Dividend Contender with 11 consecutive years of dividend growth. CBOE initiated its dividend back in 2010 and has raised it every year since, including coming out of the worst of the COVID-19 crisis from early 2020.

Over the 11-year streak, CBOE's year-over-year dividend growth has ranged from 8.3% to 22.7% with an average of 14.7% and a median of 14.2%.

There's been 8 rolling 3-year periods during CBOE's dividend growth streak with annualized dividend growth ranging from 9.7% to 21.0% with an average of 14.5% and a median of 13.9%.

The 1-, 3-, 5- and 10-year rolling period annualized dividend growth rates from CBOE since 2010 can be found in the following table.

Year Annual Dividend 1 Year 3 Year 5 Year 10 Year
2010* $0.40
2011 $0.44 10.00%
2012 $0.54 22.73%
2013 $0.66 22.22% 18.17%
2014 $0.78 18.18% 21.03%
2015 $0.88 12.82% 17.68% 17.08%

This article was written by

4.33K Followers
I started a dividend growth investment strategy a few years ago and am aggressively growing my portfolio to churn out enough dividends to reach financial independence.

Analyst’s Disclosure:I am/we are long CBOE. I wrote this article myself, and it expresses my own opinions. I am not receiving compensation for it (other than from Seeking Alpha). I have no business relationship with any company whose stock is mentioned in this article.

I am not a financial professional. Please consult an investment advisor and do your own due diligence prior to investing. Investing involves risks. All thoughts/ideas presented in this article are the opinions of the author and should not be taken as investment advice.

Seeking Alpha's Disclosure: Past performance is no guarantee of future results. No recommendation or advice is being given as to whether any investment is suitable for a particular investor. Any views or opinions expressed above may not reflect those of Seeking Alpha as a whole. Seeking Alpha is not a licensed securities dealer, broker or US investment adviser or investment bank. Our analysts are third party authors that include both professional investors and individual investors who may not be licensed or certified by any institute or regulatory body.

Recommended For You

About CBOE Stock

SymbolLast Price% Chg
Market Cap
PE
Yield
Rev Growth (YoY)
Short Interest
Prev. Close
Compare to Peers

More on CBOE

Related Stocks

SymbolLast Price% Chg
CBOE
--