Lemon_tm
By Elisa Mazen, Michael Testorf, CFA & Pawel Wroblewski, CFA
Emerging Growth Stocks on the Mend
Market Overview
After robust performance in the first half of the year, international equities continued to struggle in the fourth quarter due to market concerns about tariff wars and potentially other punitive measures that could be levied by the second Trump administration. The stronger U.S. dollar (USDOLLAR, DXY) and negative sentiment over the current state of political affairs in Europe also weighed on the largest developed markets. The benchmark MSCI EAFE Index declined 8.11% in the quarter to finish the year up just 3.82%. The MSCI Emerging Markets Index fell 8.01% to finish 2024 up 7.50%.
From a regional standpoint, Canada outperformed the index for the quarter. Canada has been a market where the ClearBridge International Growth EAFE Strategy has been consistently overweight versus the EAFE benchmark, which does not include Canada. Our view is that the Canadian economy shares many of the same characteristics as the Australian market, but at a very attractive discount. Japan and the United Kingdom lost ground but also outperformed the index while Europe Ex U.K. and Asia Ex Japan suffered the widest losses and underperformed.
Unlike in the U.S., where moderating inflation has been accompanied by resilient GDP growth, Europe and the U.K. continue to face recession risks. While the European Central Bank (along with Switzerland) took the lead among global central banks in cutting rates and continued to ease policy aggressively in the fourth quarter, inflation remains above targets. Political turmoil in Europe’s two largest economies — Germany and France — as well as continued weakness in its key export market of China have been exacerbated by Trump’s threat of tariffs. Meanwhile, hopes for resolution of the Russia-Ukraine war, and the reconstruction spending that would follow, seem far off.
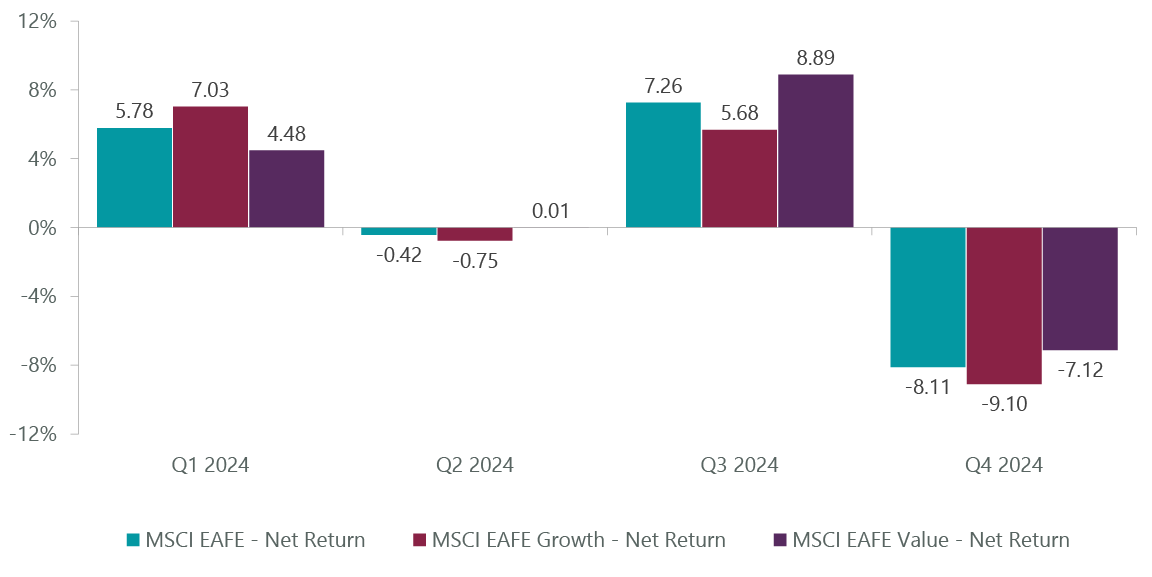
In stark contrast to continued growth momentum in the U.S., international growth stocks declined 9.10% for the quarter and underperformed their value counterparts by 198 basis points. For the year, growth stocks underperformed value by 364 bps, owing in part to the different composition of the EAFE benchmark compared to the S&P 500 Index. (SP500, SPX)
Exhibit 1: MSCI Growth vs. Value Performance

As of Dec. 31, 2024. Source: FactSet.
Despite this style divergence in favor of value, the Strategy outperformed the benchmark for the fourth quarter and the full year on a gross basis. Strong selection was the primary driver of results as our portfolio companies were able to deliver positive returns that belied the weak macro backdrop across Europe and a transitional period in Japan.
Contributions for the quarter were centered among holdings in our emerging and stable growth buckets, companies including Canadian e-commerce enablement provider Shopify (SHOP), German enterprise software maker SAP and Singapore-based e-commerce and gaming platform Sea Limited (SE). Those names were supported by stable growers London Stock Exchange Group (OTCPK:LDNXF), SONY and Taiwan Semiconductor (TSM).
These diversified results offset weakness in the portfolio’s pharmaceutical holdings. Diabetes and obesity drug maker Novo Nordisk (NVO), the portfolio’s second largest position, declined following a disappointing clinical trial relative to company-set expectations for a next-generation weight loss molecule. We believe investors overreacted to the slight miss of its efficacy targets and believe a close evaluation of the data shows efficacy in the molecule. Importantly, the trial was not a failure and we expect the drug combination will be the best weight loss drug on the market. British pharmaceutical maker AstraZeneca (AZN) also sold off during the quarter but maintains a leading position in new treatments for cancer.
We believe the opportunities for clinical breakthroughs remain, which motivated our fourth-quarter purchase of UCB (OTCPK:UCBJF), a Belgian biotechnology firm with R&D and commercial treatments in inflammation and immunology (I&I) as well as a portfolio of anti-epileptic medications. The company is undergoing a portfolio transition between its historical products and five key new ones. Bimzelx, in I&I, is expected to be a blockbuster medication, while joint treatment Evenity, for which UCB books substantial operating income from its partnership with Amgen, generated $1.5 billion in global sales in 2024 and should continue to grow robustly.
Portfolio Positioning
We remained active in the fourth quarter, adding seven new positions while exiting three others. A repurchase of audio streaming and podcast service Spotify (SPOT) marked the largest new addition. Since we sold the stock in the second quarter of 2021, management has made two key changes to drive material profit upgrades: the company implemented two rounds of price increases across all subscription services and sharply cut costs to enhance earnings. The former led to growth in average revenue per user after years of decline, while the latter resulted in meaningful operating margin expansion. In the meantime, Spotify has maintained a strong market position, expanding wallet share while increasing the total addressable market for its services.
Luxury goods has represented our primary consumer discretionary exposure over the last several years, which we added to with the purchase of French accessories maker Hermes (OTCPK:HESAY). The company limits the supply of its ultra-premium, handcrafted leather goods despite huge consumer demand. While this has led to waitlists and lower potential growth, it has also underpinned the brand’s desirability and exclusivity. We see opportunities for Hermes through increased volume, pricing power and product categories such as ready to wear, jewelry, watches and beauty still in early stages of growth.
We also continued to augment our weights in Japan with the purchase of Mitsubishi UFJ Financial Group (MUFG) and industrial gases provider Nippon Sanso Holdings (OTCPK:TYNPF).
Sales during the quarter included French eyecare provider EssilorLuxottica (OTCPK:ESLOF), as it approached our price target, as well as Ireland-based IT consultant Accenture (ACN) and Swedish specialty technical instrument provider Hexagon (OTCPK:HXGBF).
Outlook
The idea of U.S. exceptionalism may have reached its zenith in 2024 as its economy continued to deliver solid growth with inflation coming mostly under control, leading to outsize equity returns. We believe the second Trump administration introduces a wild card into that momentum and, with U.S. equity valuations well above average, leaves little room for error should tariff or related geopolitical policies create volatility. International markets, on the other hand, are priced for little progress, which we believe creates an overlooked opportunity for active growth investors like ourselves.
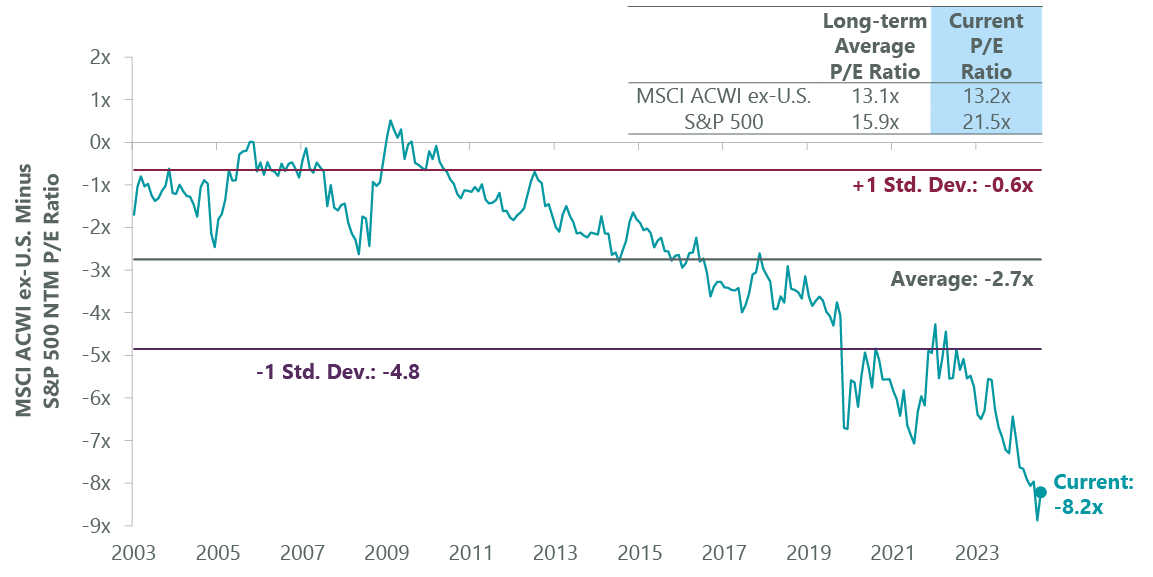
Exhibit 2: International Equity Leadership Following the Cut

Data as of Dec. 31, 2024. Sources: FactSet, MSCI, S&P.
We see several catalysts that could help international equities close the performance gap in the year ahead. The first is tariffs. In his first term, Trump ended up implementing less stringent and more limited tariffs then had been suggested on the campaign trail. Should his continued tough talk on tariffs end up being more of a negotiating tool than actual trade policy, this would be a boon to the export-driven European and Japanese economies. Second would be an end to the Russia-Ukraine conflict, which could generate significant stimulus for Europe overall as Ukraine would require a kind of Marshall Plan to revive its economy. The World Bank estimates $480 billion in terms of reconstruction costs, creating significant demand for areas like the materials sector in supplying cement and steel.
The third potential driver is that two of the largest international economies, Germany and Japan, are well behind the U.S. in terms of fiscal stimulus measures. Political upheaval in Germany could remove past impediments to greater spending. With elections scheduled for the first quarter, accommodative measures could be implemented in Germany as early as the second quarter, potentially boosting spending on infrastructure and areas like semiconductors. Japan, meanwhile, recently announced massive stimulus of ¥1.8 trillion that will be used to fund its energy transition.
Taken together, along with developed market valuations that have barely budged in the last 20 years (compared to a 40% rise in U.S. multiples), we see scope for a reversion to commence in global equity leadership. We believe the Strategy’s diversified approach to growth is well-suited to participate in this progress over the coming year.
Portfolio Highlights
During the fourth quarter, the ClearBridge International Growth EAFE Strategy outperformed its MSCI EAFE Index benchmark as a result of solid downside protection, a hallmark of our approach. On an absolute basis, the Strategy endured losses across eight of the nine sectors in which it was invested (out of 11 total), with the communication services sector the lone contributor while the health care and industrials sectors were the primary detractors.
On a relative basis, overall stock selection and sector allocation contributed to performance. In particular, stock selection in the IT, communication services and materials sectors drove results. Conversely, stock selection in the industrials and utilities sectors, an underweight to financials and an overweight to health care detracted from performance.
On a regional basis, stock selection in Asia Ex Japan as well as overweights to North America (Canada) and emerging markets supported performance while stock selection in North America, Japan and emerging markets and an underweight to Japan proved detrimental.
On an individual stock basis, the largest contributors to absolute returns in the quarter included Shopify and SAP in the IT sector, Sony in the consumer discretionary sector, Argenx (ARGX) in the health care sector and Sea Limited in the communication services sector. The greatest detractors from absolute returns included positions in Novo Nordisk in health care, ASML in IT, Industria de Diseno Textil (OTCPK:IDEXY, Inditex) in consumer discretionary, Canadian Pacific Kansas City (CP) in industrials and EDP (OTCPK:EDPFY) in utilities.
In addition to the transactions mentioned above, the Strategy repurchased shares of Check Point Software (CHKP) in IT and Marks and Spencer (OTCQX:MAKSF) in consumer discretionary.
Elisa Mazen, Managing Director, Head of Global Growth, Portfolio Manager
Michael Testorf, CFA, Managing Director, Portfolio Manager
Pawel Wroblewski, CFA, Managing Director, Portfolio Manager
| Past performance is no guarantee of future results. Copyright © 2024 ClearBridge Investments. All opinions and data included in this commentary are as of the publication date and are subject to change. The opinions and views expressed herein are of the author and may differ from other portfolio managers or the firm as a whole, and are not intended to be a forecast of future events, a guarantee of future results or investment advice. This information should not be used as the sole basis to make any investment decision. The statistics have been obtained from sources believed to be reliable, but the accuracy and completeness of this information cannot be guaranteed. Neither ClearBridge Investments, LLC nor its information providers are responsible for any damages or losses arising from any use of this information. Performance source: Internal. Benchmark source: Morgan Stanley Capital International. Neither ClearBridge Investments, LLC nor its information providers are responsible for any damages or losses arising from any use of this information. Performance is preliminary and subject to change. Neither MSCI nor any other party involved in or related to compiling, computing or creating the MSCI data makes any express or implied warranties or representations with respect to such data (or the results to be obtained by the use thereof), and all such parties hereby expressly disclaim all warranties of originality, accuracy, completeness, merchantability or fitness for a particular purpose with respect to any of such data. Without limiting any of the foregoing, in no event shall MSCI, any of its affiliates or any third party involved in or related to compiling, computing or creating the data have any liability for any direct, indirect, special, punitive, consequential or any other damages (including lost profits) even if notified of the possibility of such damages. No further distribution or dissemination of the MSCI data is permitted without MSCI’s express written consent. Further distribution is prohibited. |
Editor's Note: The summary bullets for this article were chosen by Seeking Alpha editors.
Editor's Note: This article discusses one or more securities that do not trade on a major U.S. exchange. Please be aware of the risks associated with these stocks.