
Gary Yeowell
Focus of Article:
The focus of Part 1 of this article is to analyze Golub Capital BDC Inc.’s (NASDAQ:GBDC) recent results and compare a handful of the company’s metrics to 11 business development company (“BDC”) peers. This analysis will show past and current data with supporting documentation. Table 1 will compare GBDC’s recent net asset value (“NAV”) economic return (loss), adjusted net investment income (“NII”), stock price to annualized NII ratio, and percentage of total investment income attributable to capitalized payment-in-kind (“PIK”)/deferred interest income to the 11 BDC peers. Table 1 will also provide a premium (discount) to estimated current NAV analysis using stock prices as of 3/7/2025. Table 2 will compare GBDC’s investment portfolio (including several additional metrics) as of 9/30/2024 and 12/31/2024 to the 11 BDC peers.
I'm writing this two-part article due to the continued requests that such an analysis be specifically performed on GBDC and some of the company’s BDC peers at periodic intervals. These BDC peers include Ares Capital Corp. (ARCC), Blackstone Secured Lending Fund (BXSL), Capital Southwest Corp. (CSWC), FS KKR Capital Corp. (FSK), Gladstone Investment Corp. (GAIN), Main Street Capital Corp. (MAIN), Oaktree Specialty Lending Corp. (OCSL), Blue Owl Capital Corp. (OBDC), SLR Investment Corp. (SLRC), TriplePoint Venture Growth BDC Corp. (TPVG), and Sixth Street Specialty Lending Corp. (TSLX). Directly due to low subscriber demand/popularity, I decided to drop coverage of MidCap Financial Investment Corp. (MFIC), PennantPark Floating Rate Capital Ltd. (PFLT), Blackrock (BLK) and TCP Capital Corp. (TCPC) in January 2025.
Understanding the characteristics of a company’s investment portfolio and operating performance can shed some light on which companies are overvalued or undervalued strictly per a “numbers” analysis. This is not the only data that should be examined to initiate a position within a particular stock/sector. However, I believe this analysis would be a good “starting point” to begin a discussion on the topic. My Buy, Sell, or Hold recommendation and current price target for GBDC will be in the “Conclusions Drawn” section of the article. This includes providing a list of the BDC stocks I currently believe are undervalued (a buy recommendation), overvalued (a sell recommendation), or appropriately valued (a hold recommendation).
NAV, Economic Return (Loss), Current Premium (Discount) to NAV, and NII Analysis - Overview:
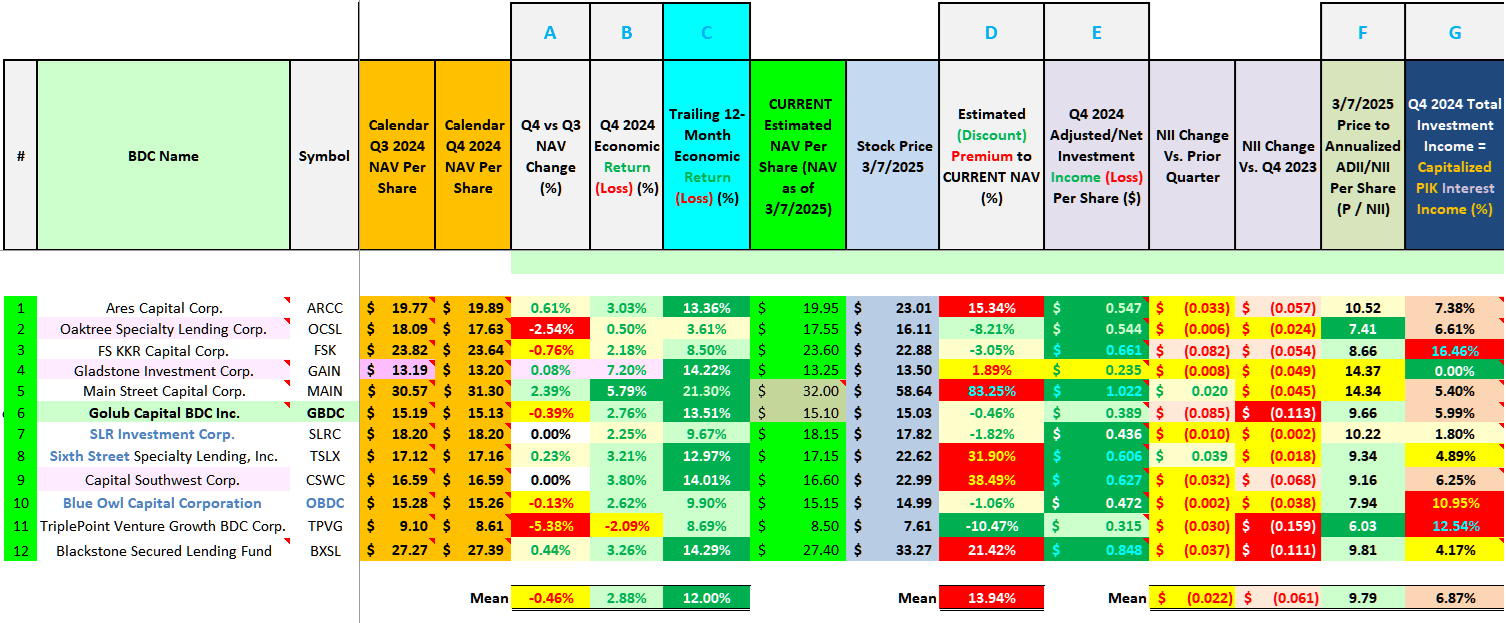
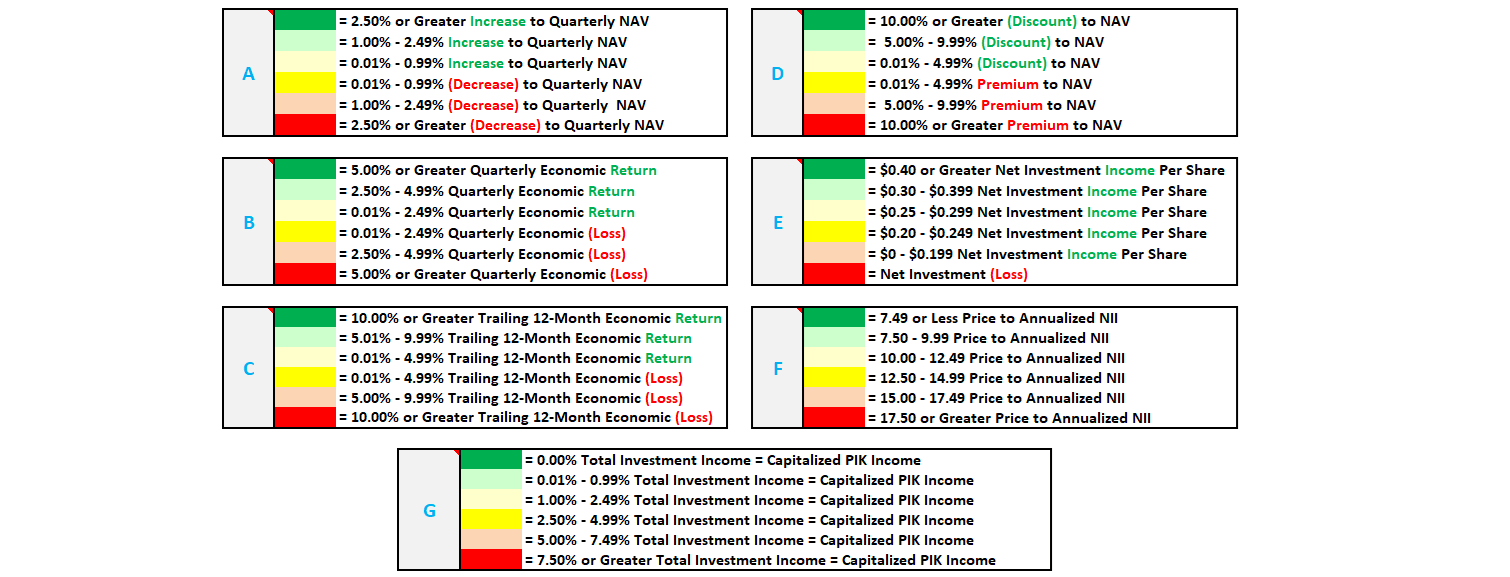
Let us start this analysis by getting accustomed to the information provided in Table 1 below. This will be beneficial when explaining how GBDC compares to the company’s 11 BDC peers regarding the metrics stated above. Due to the fact several BDC peers listed in Table 1 have a different fiscal year-end, all quarterly results are based on a calendar year-end. For instance, all metrics below are stated “Q4 2024” even though this does not correspond to every company’s fiscal year-end. Readers should be aware as such when the analysis is presented below.
Table 1a + 1b – NAV, Economic Return (Loss), Current Premium (Discount) to NAV, NII, and Capitalized PIK Analysis
The REIT Forum
The REIT Forum
(Source: Table created by me, obtaining historical stock prices from NASDAQ and each company’s NAV per share figures from the SEC’s EDGAR Database)
Table 1 above provides the following information on GBDC and the 11 BDC peers (see each corresponding column): 1) NAV per share at the end of calendar Q3 2024; 2) NAV per share at the end of calendar Q4 2024; 3) NAV per share change during calendar Q4 2024 (percentage); 4) economic return (loss) (change in NAV and accrued dividend) during calendar Q4 2024 (percentage); 5) economic return (loss) during the trailing 12-months (percentage); 6) my estimated current NAV per share (NAV as of 3/7/2025); 7) stock price as of 3/7/2025; 8) 3/7/2025 premium (discount) to my estimated current NAV (percentage); 9) NII (or adjusted NII where applicable) per share during calendar Q4 2024; 10) NII (or adjusted NII where applicable) per share change versus the prior quarter; 11) NII (or adjusted NII where applicable) per share change versus calendar Q4 2023; 12) 3/7/2025 stock price to annualized NII ratio; and 13) percentage of total investment income attributable to capitalized PIK (deferred) interest income during calendar Q4 2024 (percentage).
Now that an overview has been provided, let us start the comparative analysis.
Analysis of GBDC:
Using Table 1 above as a reference, GBDC had a NAV of $15.19 per share at the end of calendar Q3 2024. GBDC had a NAV of $15.13 per share at the end of calendar Q4 2024. This calculates to a quarterly NAV decrease of ($0.06) per share or (0.39%). The majority of this NAV decrease was directly in relation to GBDC’s special periodic dividends during the quarter. When including GBDC’s quarterly base dividend of $0.39 per share and special periodic dividends totaling $0.09 per share, the company had an economic return (change in NAV and accrued dividends) of $0.42 per share or 2.76% for calendar Q4 2024. It should also be noted GBDC had a trailing 12- and 24-month economic return of 13.51% and 26.24%, respectively. Both percentages were slightly above the covered 12 BDC peer average (a positive catalyst/trend).
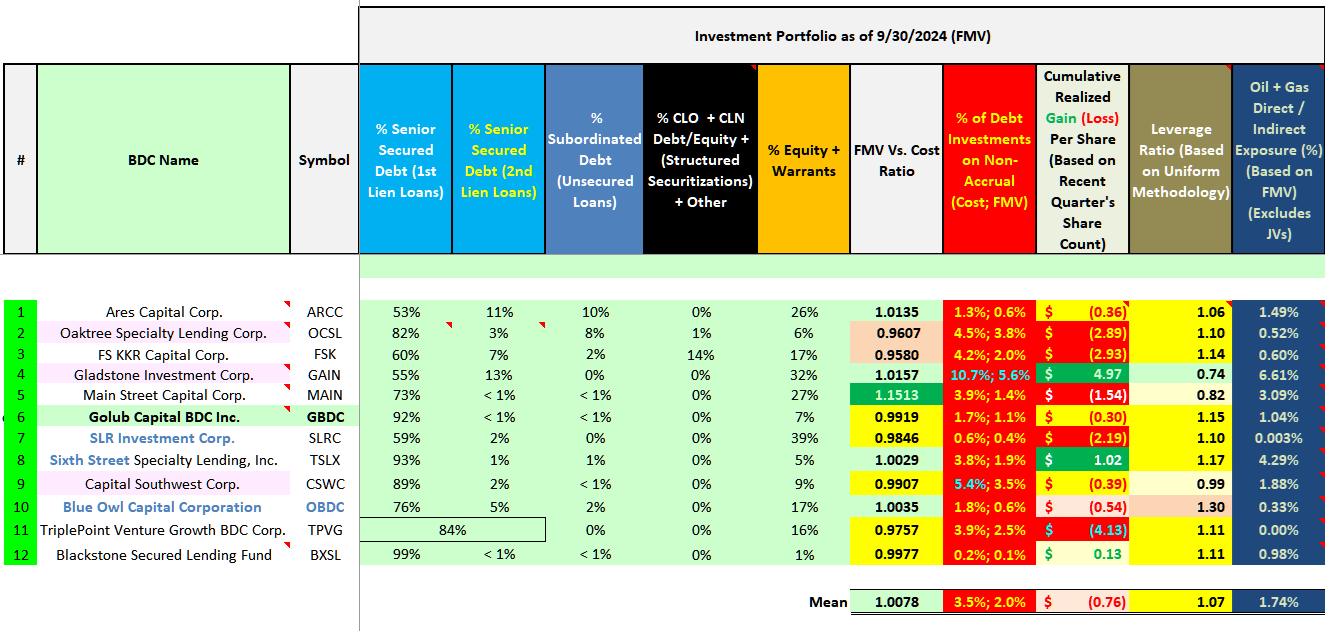
GBDC’s performance during the past four quarters was mainly attributable to the following three factors: 1) Minor net underpayment of dividends when compared to the company’s NII/adjusted NII; 2) modest net realized losses within a handful of exited portfolio companies; and 3) minor net unrealized appreciation within a majority of the company’s active investment portfolio. This is a good transition to the next topic of discussion, an analysis of GBDC’s investment portfolio (including several additional metrics) as of 9/30/2024 and 12/31/2024. To begin this analysis, Table 2 is provided below.
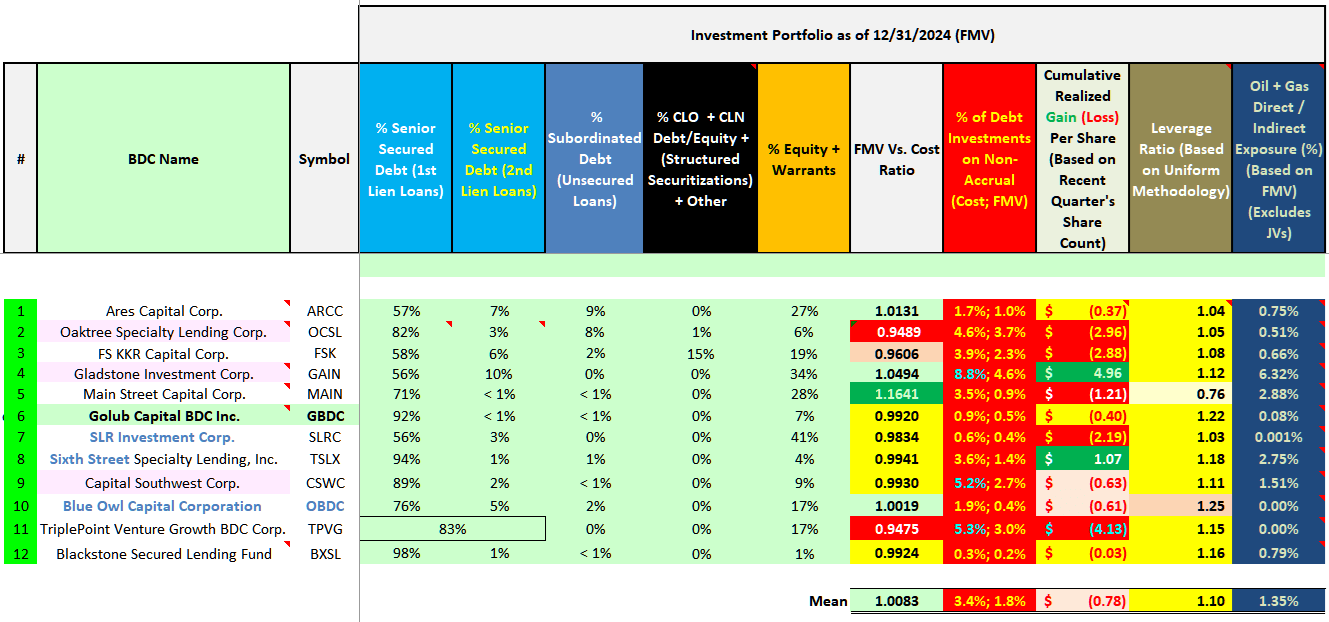
Tables 2a + 2b – Investment Portfolio Composition Analysis (Including Several Additional Metrics; 12/31/2024 Versus 9/30/2024)
The REIT Forum
The REIT Forum
(Source: Tables created by me, directly obtaining some figures/percentages from the SEC’s EDGAR Database [link provided below Table 1]. All remaining figures/percentages were calculated using data obtained within the SEC’s EDGAR Database)
Using Tables 2a and 2b above as a reference, GBDC had 92% and less than 1% of the company’s investment portfolio in senior secured first- and second-lien loans as of 12/31/2024, respectively. As such, these types of loans comprised the majority of GBDC’s investment portfolio. When compared to the prior quarter, GBDC’s percentage of senior secured first- and second-lien loans remained unchanged. GBDC also had less than 1%, 0%, and 7% of the company’s investment portfolio in subordinated debt (unsecured loans), collateralized loan obligations (“CLO”)/credit-linked notes (“CLN”) (structured securitizations) + other, and equity/warrants, respectively. When compared to the prior quarter, GBDC’s percentage of subordinated debt (unsecured loans), CLO/CLN (structured securitizations) + other, and equity/warrants also remained unchanged. As such, there was not a notable shift in investment portfolio composition during calendar Q4 2024.
I would also point out GBDC’s proportion of second-lien loans and subordinated debt is very low when compared to the company’s 11 BDC peers. Simply put, this is generally a positive characteristic regarding potential credit risk/recoveries in a recessionary environment (consider general credit hierarchy). I believe GBDC’s below average non-accrual percentages are direct evidence of the company’s more cautionary strategy regarding capital stack/credit hierarchy.
As of 12/31/2024, GBDC’s investment portfolio had a “fair market value (“FMV”) vs. cost” ratio of 0.9920x. When compared to the 11 other BDC peers within this analysis, this ratio was fractionally below the mean of 1.0083x (a very slightly negative factor/trend). When compared to a ratio of 0.9919x as of 9/30/2024, GBDC’s ratio remained relatively unchanged during calendar Q4 2024. This was mainly the result of partial realized losses in conjunction with three restructurings offset by modest unrealized appreciation within the remainder of GBDC’s investment portfolio. A more detailed “breakdown” of GBDC’s quarterly performance was recently provided to our Investing Group subscribers via a quarterly earnings assessment article.
GBDC had 0.9% and 0.5% of the company’s investment portfolio on “non-accrual” status as of 12/31/2024; based on its amortized cost basis and FMV, respectively. When compared to the 11 BDC peers as of 12/31/2024, GBDC’s amortized cost and FMV non-accrual percentage were slightly - modestly below the mean of 3.4% and 1.8%, respectively (a positive catalyst/trend).
Since the company’s initial public offering (“IPO”) in 2010, GBDC’s investment portfolio as of 12/31/2024 has generated a cumulative realized loss of ($0.40) per share (when based on a per share count as of 12/31/2024). GBDC’s cumulative realized loss figure was slightly - modestly more attractive when compared to the mean loss of ($0.78) per share (a positive catalyst/trend). I believe calculating a BDC’s cumulative realized gain (loss) per share amount provides an extremely useful metric when analyzing the long-term performance of management’s underwriting abilities, due diligence, expertise, and operational performance. This metric provides direct evidence GBDC’s management team has, regarding a majority of instances, continued to find attractive debt/equity investments over a long period of time which, more times than not, have ultimately delivered attractive risk-adjusted returns.
As of 12/31/2024, 0.08% of GBDC’s portfolio had debt and equity investments within the oil and gas sector (based on FMV; including certain investments in the energy sector which had “oil and gas” characteristics and/or services closely linked to the sector). When compared to the 11 other BDC peers within this analysis, GBDC’s oil and gas exposure was slightly below the mean of 1.35%. When compared to the prior quarter, GBDC’s exposure to the oil and gas sector slightly decreased. Even though larger oil and gas companies benefited during most of 2022 from a net increase to commodity prices tied to inflation and the ongoing Russia/Ukraine conflict, I would point out most sector prices have largely retraced during late 2022 – 2025. In addition, smaller/private oil and gas companies are not “out of the woods” (still high-cost outlays making breakeven prices higher). This could be a short- or long-term event dependent upon many unknown geopolitical/macroeconomic variables. As such, I would remain a bit cautious considering the ramifications of this specific sector regarding high-yield/speculative-grade credit. I believe GBDC’s continued very low percentage attributed to oil and gas companies remains a positive catalyst/trend.
Once again using Table 1 as a reference, GBDC reported adjusted NII (which excludes merger-related premium amortization) of $0.389 per share during calendar Q4 2024. I prefer to track/utilize GBDC’s adjusted NII metric as opposed to NII (more indicative of net investment company taxable income [ICTI]). When comparing each company’s stock price as of 3/7/2025 to its annualized NII (or where applicable adjusted NII), GBDC had the seventh-lowest ratio at 9.66x. GBDC’s annualized adjusted NII ratio was slightly below the 12-peer ratio of 9.79x as of 3/7/2025 (a slightly positive catalyst/trend). Historically speaking, GBDC’s price-to-earnings ratio as of 3/7/2025 was attractive/low (a positive catalyst/trend).
During calendar Q4 2024, 5.99% of GBDC’s total investment income was attributable to capitalized PIK/deferred interest income which was a decrease of (1.14%) when compared to the prior quarter. As such, a slight decrease (a slightly positive factor/trend). That said, to remain unbiased, when compared to the 11 other BDC peers within this analysis, this was near (less than 1.0%) the mean of 6.87%. I believe it's never a positive catalyst/trend when a BDC has any portion of its accrued income classified as being capitalized/deferred. Simply put, under GAAP, capitalized PIK interest/dividend income is revenue that's currently being “booked” but has not actually been received in cash yet (deferred). In a majority of cases, capitalized PIK interest income is paid in cash at the maturity of that particular loan/when a sale occurs. However, in my experience, more times than not capitalized PIK interest income is a contractual amendment regarding a specific portfolio company which is, at the time, having operational difficulties (which increases the probably of the eventual inability of paying its loan obligations). This especially holds true when a specific debt investment had no capitalized PIK feature at the origination of a particular loan but is currently accruing 100% capitalized PIK interest income due to a loan modification/restructuring.
Simply put, in a majority of cases, it's a “slick” strategy of continuing to record accrued interest income only to write-off this capitalized interest income at a later date; usually at loan maturity by classifying that “lost deferred interest” as a reduction in the debt investment’s proceeds (a realized loss) as opposed to lowering previously accrued income by the accumulated capitalized PIK balance. I'm not stating this occurs all the time, but certain BDC peers tend to utilize this “phantom income” strategy regularly. In particular, PSEC has been prone to this strategy to a greater degree over the years vs. all the other BDC peers within this analysis which was pointed out for years (and one of the reasons I dropped that BDC back in 2024). As such, it could be the case capitalized PIK interest income is never “completely” received in cash upon maturity/when a sale occurs. In my professional opinion, if a BDC has a large/above average portion of its investment income classified/accrued as capitalized PIK interest income, it should be seen as a potential concern regarding future performance/credit quality. In the end, one really just has to go “case-by-case” to determine the overall “viability” of a BDC actually eventually receiving this capitalized PIK/deferred interest income in the future. Something I continually monitor/track in my modeling.
As of 3/7/2025, GBDC’s stock price traded at $15.03 per share. When calculated, GBDC’s stock price was trading at a discount to my estimated current NAV (NAV as of 3/7/2025; $15.10 per share) of ($0.07) per share or (0.46%). This was modestly more attractive than the 12-BDC covered peer average of a premium of 13.94% (a positive catalyst/trend). I continue to believe GBDC should trade at a minor - modest premium to the company’s current NAV. As such, based on my proven valuation methodology over various interest rate/economic cycles, GBDC continues to be one of a handful of BDC peers that is appropriately valued (almost undervalued) in my professional opinion.
Comparison of GBDC’s NAV, Economic Return, Valuation, NII, and Other Metrics to 11 BDC Peers in Ranking Order:
The REIT Forum Feature
Conclusions Drawn (PART 1):
PART 1 of this article has analyzed GBDC and 11 other BDC peers in regards to the following metrics: 1) trailing 12-month economic return (loss) (good indicator of recent overall performance); 2) percentage of investments on non-accrual status as of 12/31/2024 (good indicator of overall portfolio health/credit risk); 3) cumulative gain (loss) per share as of 12/31/2024 (great indicator of long-term performance); 4) current premium (discount) to my estimated current NAV per share (NAV as of 3/7/2025) (very good indicator of overall valuation); 5) current stock price to annualized NII ratio (good indicator of overall valuation); and 6) percentage of total investment income attributable to capitalized PIK (deferred) interest income (good indicator of overall portfolio health/credit risk).
When compared to the 11 other BDC peers within this analysis, I believe GBDC continues to outperform a majority of the company’s BDC peers I currently cover. This includes, but is not limited to, GBDC’s attractive adjusted NII per share (though, to remain unbiased, has net decreased over the prior several quarters [similar to most sector peers]), a modestly below average percentage of investments on non-accrual status as of 12/31/2024, a slightly - modestly more attractive cumulative realized gain (loss) per share amount as of 12/31/2024, a very low exposure to the oil and gas sector (including certain investments in the energy sector which had oil and gas characteristics and/or services closely linked to the sector), an above average trailing 12-month economic return percentage, and a very slightly more attractive stock price to annualized adjusted NII ratio (all positive catalysts/trends).
In addition, GBDC fairly recently (effective July 2023) lowered management fees from 1.375% of total assets less cash and cash equivalents to just 1.00% is currently tied for the lowest percentage out of the externally-managed covered BDC peers. Furthermore, effective January 2024, GBDC lowered the cap/max regarding the company’s income incentive fees from 20.0% of pre-incentive fee NII to 15.0% which is currently the lowest percentage out of the externally-managed covered BDC peers. This includes continuing to have the highest income incentive fee “hurdle” rate (rate of return) of 8.00%. Simply put, this will continue to positively impact shareholders via lower proportionate fees versus all other externally-managed BDC covered peers.
That said, to remain non-bias, this article also highlighted GBDC had a near average FMV versus cost ratio and capitalized PIK interest income percentage (both neutral/negative factors/trends). In my opinion, GBDC’s PIK interest income percentage continues to be the company’s biggest negative factor/trend (although this percentage has been relatively stable over the past 2 years [unlike a majority of covered BDC peers]).
Looking back, I previously correctly identified the high - very high probability of multiple GBDC base dividend increases and/or special periodic dividends during late 2022 - 2024. This was mainly due to the U.S. London Interbank Offered Rate (LIBOR)/Standard Overnight Financing Rate (“SOFR”)/PRIME very quickly moving past all floors on the asset side of the balance sheet, along with refinancing outstanding borrowings with longer-term, lower cost debt on the liability side of the balance sheet, during 2021.
That said, to remain non bias, during 2024 - 2025 one had/has to continue to monitor the weighted average annualized yield on new loan originations versus exiting debt investments as there remains a pretty good “lag” in this specific metric. Something I continually track. In addition, I believe the majority of sector earnings peaked during late 2023 – early 2024 (recently plateaued). The rapid NII growth that sector peers experienced during 2022 - 2023 simply did not occur during 2024 (nor will occur during 2025). As the FOMC began to reduce the Federal Funds Rate (started in September 2024), sector earnings will gradually decrease over time. The severity of decreases will vary peer-to-peer (which I continuously project/model). This notion is already embedded in all price targets. Furthermore, credit risk will almost certainly continue to rise (albeit mildly) throughout the sector during 2025 but should begin to slowly ease during 2026.
However, I continue to believe GBDC is better positioned to weather a potential minor - modest recession when compared to most sector peers (as highlighted in the analysis above). In addition, GBDC’s “cushion” to maintain the company’s previously increased base quarterly dividend per share rate of $0.39 per share remains good. That said, as correctly pointed out last quarter, GBDC’s special periodic dividend would very likely continue to net decrease over time (similar to most sector peers). That said, to remain unbiased, the pace at which GBDC reduced the company’s special periodic dividend during calendar Q1 2025 was a bit quicker than originally anticipated.
My Buy, Sell, or Hold Recommendation:
From the analysis provided above, including additional factors not discussed within this article (additional metrics covered in PART 2), I currently rate GBDC as a Sell when I believe the company’s stock price is trading at or greater than a 7.5% premium to my projected current NAV (NAV as of 3/7/2025; $15.10 per share), a Hold when trading at less than a 7.5% premium but less than a (2.5%) discount to my projected current NAV, and a BUY when trading at or greater than a (2.5%) discount to my projected current NAV.
Therefore, with a closing price as of 3/11/2025 of $14.64 per share, I currently rate GBDC as slightly undervalued from a stock price perspective.
As such, I currently believe GBDC is a BUY recommendation (but very close to a Hold recommendation).
My current price target for GBDC is approximately $16.25 per share. This is currently the price where my recommendation would change to a Sell. The current price where my Buy recommendation would change to a Hold is approximately $14.70 per share. Put another way, the following are my current Buy, Sell, or Hold per share recommendation ranges for GBDC (our Investing Group subscribers get this type of data on all 12 BDC (and 18 mortgage real estate investment trust [mREIT]) stocks I currently cover on a weekly basis):
$16.25 per share or above = SELL (Overvalued)
$14.71 - $16.24 per share = HOLD (Appropriately Valued)
$13.21 - $14.70 per share = BUY (Undervalued)
$13.20 per share or below = STRONG BUY (Notably Undervalued)
BDC Sector Recommendations as of 3/7/2025:
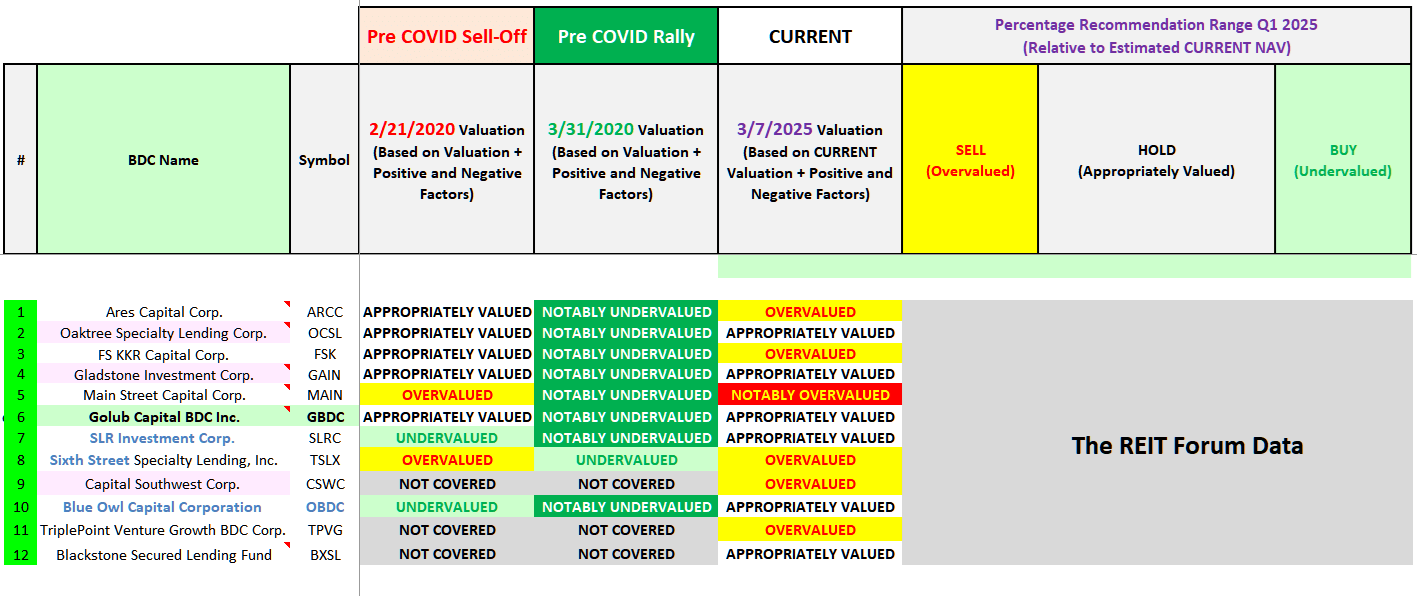
Table 10 – Past and Current BDC Recommendations
The REIT Forum
(Source: Table created by me, including all past and present recommendations based on data obtained from the SEC’s EDGAR Database [link provided below Table 1a])
Table 10 above provides the following information on GBDC and the 11 BDC peers (see each corresponding column): 1) 2/21/2020 BUY, SELL, or HOLD recommendation (pre COVID-19 sell-off); 2) 3/31/2020 BUY, SELL, or HOLD recommendation (pre COVID-19 rally); and 3) 3/7/2025 BUY, SELL, or HOLD recommendation range, relative to my estimated CURRENT NAV.
As of 3/7/2025, I had 0 BDCs rated as NOTABLY UNDERVALUED (STRONG BUY), 0 rated as UNDERVALUED (BUY), 6 rated as APPROPRIATELY VALUED (HOLD), 5 rated as OVERVALUED (SELL), and 1 as NOTABLY OVERVALUED (STRONG SELL).
GBDC moved from a HOld to a Buy on 3/11/2025 (after all research/data compilation for this article was already finished).
Simply put, certainly not as bullish as March - April 2020 or even during the summer of 2024. I currently believe the sector, as a whole, is appropriately valued (including GBDC) – slightly overvalued. I would just be mindful knowing high-yield/speculative-grade credit spreads directly impact broader asset valuations. I continue to project a net widening of spreads during 2025. This is something I have continued to discuss with subscribers. Important to understand.
The analysis performed above does not provide “every” catalyst/factor to consider when choosing a BDC investment. However, I believe this analysis is a good starting point to begin a discussion on the topic. Additional metrics will be analyzed in PART 2 of this article. Part 2 will take a look at GBDC’s past and current dividend rates, yields, and other similar metrics and compare the results to the 14 other BDC peers. Several of these metrics have a direct impact on future operations/results as events unfold. This includes dividend projections for all 12 peers for calendar Q2 2025/each applicable company’s next set of dividend projections.
My Personal GBDC Past + Current Stock Disclosures:
The following are my GBDC past and current stock disclosures and total returns since I have been writing on Seeking Alpha (since 2013):
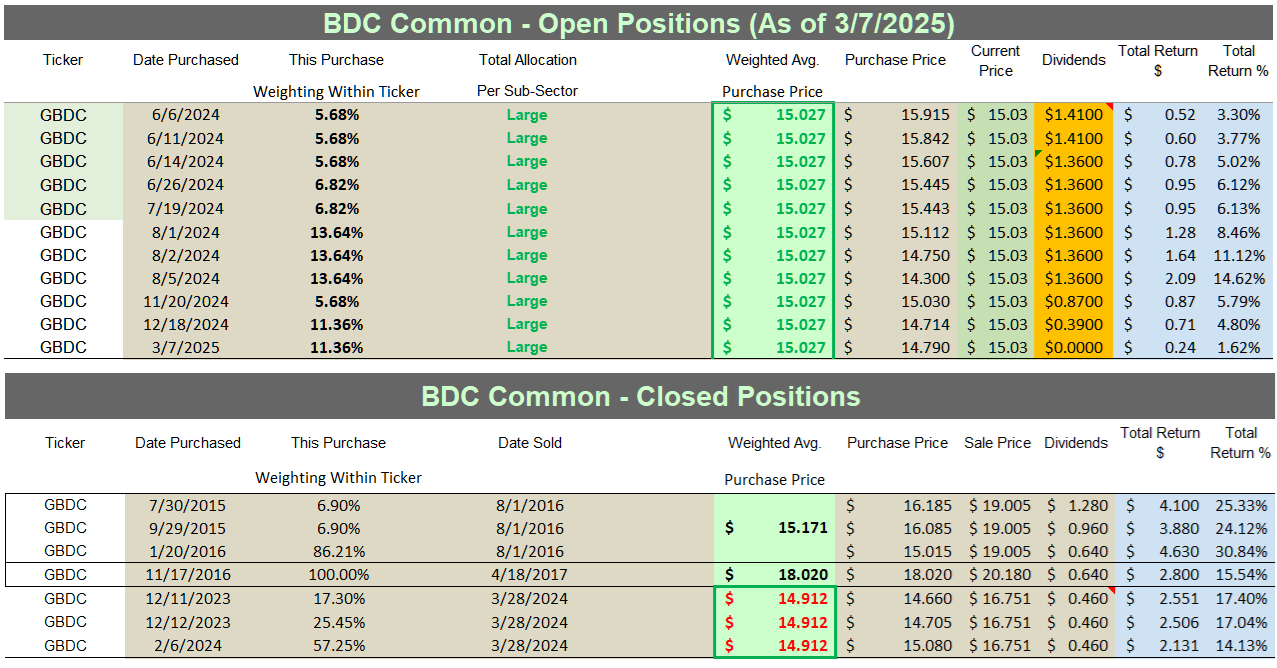
Table 11 – GBDC Past + Current Stock Disclosures/Returns
The REIT Forum
Source: Taken Directly from the REIT Forum’s © Spreadsheets/Data
Final Note: All trades/investments I have performed over the past 8+ years have been disclosed to readers in “real time” (that day at the latest) via either the StockTalks feature of Seeking Alpha or, more recently, the “live chat” feature of our Investing Group (which cannot be changed/altered). Through these resources, readers can look up all my prior disclosures (buys/sells) regarding all companies I cover here at Seeking Alpha (see my profile page for a list of all stocks covered). Through StockTalk disclosures and/or the live chat feature of the REIT Forum, at the end of February 2025 I had an unrealized/realized gain “success rate” of 90.9% and a total return (includes dividends received) success rate of 96.1% out of 77 total past and present mREIT and BDC positions (updated monthly; multiple purchases/sales in one stock count as one overall position until fully closed out). I encourage other Seeking Alpha contributors to provide real time buy and sell updates for their readers/subscribers which would ultimately lead to greater transparency/credibility. Beginning in January 2020, I transitioned all my real-time purchase and sale disclosures solely to subscribers of the REIT Forum. All applicable public articles will still have my “main ticker” purchase and sale disclosures (just not real-time alerts).
Simply put, a contributor’s/team’s recommendation track record should “count for something” and should always be considered when it comes to credibility/successful investing.
Understanding My/Our Valuation Methodology Regarding mREIT Common and BDC Stocks:
The basic "premise" around my/our recommendations in the mREIT common and BDC sectors is value. Regarding operational performance over the long-term, there are above average, average, and below average mREIT and BDC stocks. That said, better-performing mREIT and BDC peers can be expensive to own, as well as being cheap. Just because a well-performing stock outperforms the company’s sector peers over the long term, this does not mean this stock should be owned at any price. As with any stock, there is a price range where the valuation is cheap, a price where the valuation is expensive, and a price where the valuation is appropriate. The same holds true with all mREIT common and BDC peers. As such, regarding my/our investing methodology, each mREIT common and BDC peer has their own unique BUY, SELL, or HOLD recommendation range (relative to estimated current BV/NAV). The better-performing mREITs and BDCs typically have a recommendation range at a premium to BV/NAV (varying percentages based on overall outperformance) and vice versa with the average/underperforming mREITs and BDCs (typically at a discount to estimated current BV/NAV).
Each company’s recommendation range is "pegged" to estimated current BV/NAV because this way subscribers/readers can track when each mREIT and BDC peer moves within the assigned recommendation ranges (daily if desired). That said, the underlying reasoning why I place each mREIT and BDC recommendation range at a different premium or (discount) to estimated current BV/NAV is based on roughly 15-20 catalysts which include both macroeconomic catalysts/factors and company-specific catalysts/factors (both positive and negative). This investing strategy is not for all market participants. For instance, not likely a “good fit” for extremely passive investors. For example, investors holding a position in a particular stock, no matter the price, for say a period of five-plus years. However, as shown throughout my articles written here at Seeking Alpha since 2013, in the vast majority of instances I have been able to enhance my personal total returns and/or minimize my personal total losses from specifically implementing this particular investing valuation methodology. I hope this provides some added clarity/understanding for new subscribers/readers regarding my valuation methodology utilized in the mREIT common and BDC sectors.
Each investor's BUY, SELL, or HOLD decision is based on one's risk tolerance, time horizon, and dividend income goals. My personal recommendation will not fit each reader’s current investing strategy. The factual information provided within this article is intended to help assist readers when it comes to investing strategies/decisions. Please disregard any minor “cosmetic” typos if/when applicable.
I am currently "teaming up" with Colorado Wealth Management to provide full coverage on 18 mREIT and 12 BDC stocks. This includes weekly CURRENT BV and NAV per share projections. These very informative (and “premium”) projections are provided through Colorado's S.A. Investing Group. In addition, this includes additional data/analytics, weekly sector recommendations (including per share ranges), and exclusive "rapid fire" mREIT and BDC chat notes/articles after earnings.