peshkov
Infrastructure Quarterly Report 1Q 2025
Infrastructure recorded a strong quarter, with the sector (defined as the DJ Brookfield Global Infrastructure Index) outperforming the S&P 500 Index by a wider margin than in any quarter over the past 20 years. Infrastructure provided downside protection relative to the broad market decline, amid tariff commentary that drove higher levels of uncertainty and fears of a recession.
Within the portfolio, performance was generally consistent with the broad market’s preference for lower volatility. Top performers included telecom providers, cell towers, waste management, transmission & distribution, and water-focused utilities. Performance within these groups was also supported by lower interest rates as the yield on the 10-year Treasury declined ~30 basis points. Midstream positions were fairly consistent from top to bottom, maintaining recent momentum on high income generation, improving balance sheets, and supportive valuations. Laggards were generally more cyclical or thematic and included transportation and logistics, renewable developers, independent power producers, and data centers.
Looking Ahead
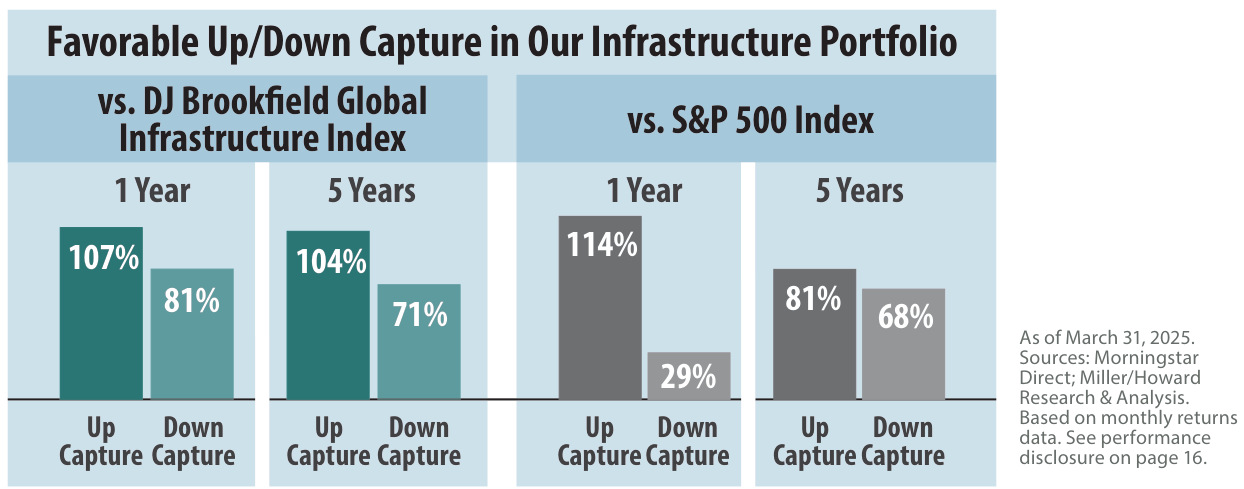
A key component of Miller/Howard’s Infrastructure portfolio is its focus on essential service providers with high barriers to entry. We have long argued that these characteristics lend themselves to stable cash flow generation, less sensitivity to the business cycle, and attractive risk-adjusted returns. This thesis is corroborated by the portfolio’s up and down capture ratios. Over the last five years as of March 31st, our Infrastructure portfolio, versus the broad market, recorded 81% up capture and 68% down capture ratios. Compared to the portfolio’s benchmark, these ratios are even stronger, with 104% up capture and only 71% down capture. With elevated levels of uncertainty in the market, we view Infrastructure as a compelling investment opportunity for clients.
Portfolio Highlights
- Dividend increases: This quarter, 17 of our 35 holdings announced dividend increases with an average increase of 5.0%.
- Increasing waste management: We initiated a position in Waste Connections (WCN) and expect the company to benefit from a differentiated strategy, focused on exclusive and secondary markets. We also added to Waste Management (WM) after a period of underperformance.
- Communication adjustments: We exited our position in Crown Castle (CCI) on the expectation that a sale of its small cell assets would result in a reduced payout and trimmed Comcast (CMCSA) as cable remains at risk of losing market share. We initiated a position in AT&T (T) expecting the company’s fibercentric wireline strategy and convergence opportunities to drive growth. We also increased our positions in American Tower (AMT) and Equinix (EQIX) on increased conviction in their growth profiles.
- Data center exposure: We trimmed our positions in Constellation Energy (CEG), Entergy (ETR), NiSource (NI), and Williams (WMB). Overall, these transactions reduce the portfolio’s exposure to data center trends after a period of relative outperformance. We reallocated utility exposure to two of the highest quality utilities, Atmos Energy (ATO) and American Water Works (AWK).
- Risk management: We exited HCA Healthcare (HCA) on increased political risks following the election. We also trimmed Targa Resources (TRGP)– twice – to reduce the portfolio’s oil beta.
Yield, Growth, Strength, Stability
- Our Income-Equity portfolios each offer a high dividend yield that is over 2.5x the yield on the S&P 500 Index, and have ample dividend coverage and reasonable leverage levels (net debt/EBITDA).
- Both portfolios trade at a significant discount to the broad market on price-to-earnings as well.
- We believe the portfolios are well-positioned for dividend growth throughout the full market cycle.
Income-Equity (with MLPs) | |||||||||||
2015 | 2016 | 2017 | 2018 | 2019 | 2020 | 2021 | 2022 | 2023 | 2024 | 1Q2025 | |
Income-Equity Yield | 4.7 | 4.0 | 3.7 | 4.3 | 3.7 | 3.6 | 3.3 | 3.6 | 3.7 | 3.6 | 3.8 |
S&P 500 Yield | 2.2 | 2.1 | 1.9 | 2.2 | 1.9 | 1.5 | 1.5 | 1.8 | 1.5 | 1.3 | 1.4 |
Ratio | 2.2x | 1.9x | 2.0x | 2.0x | 2.0x | 2.3x | 2.2x | 2.0x | 2.4x | 2.7x | 2.7x |
Income-Equity Projected Dividend Growth* | 5.8 | 5.0 | 6.3 | 7.8 | 7.3 | 5.1 | 6.0 | 6.1 | 5.5 | 5.5 | 5.4 |
S&P 500 Projected Dividend Growth** | 4.2 | 4.0 | 4.2 | 5.2 | 4.2 | 3.3 | 5.9 | 4.8 | 4.5 | 5.3 | 5.1 |
Ratio | 1.4x | 1.2x | 1.5x | 1.5x | 1.7x | 1.5x | 1.0x | 1.3x | 1.2x | 1.0x | 1.0x |
Income-Equity Dividend Coverage Ratio | 1.3x | 1.3x | 1.5x | 1.9x | 2.3x | 2.1x | 2.0x | 2.7x | 2.1x | 2.1x | 2.1x |
Income-Equity Net Debt/EBITDA*** | 2.8x | 2.0x | 1.9x | 1.4x | 1.9x | 1.9x | 1.2x | 2.0x | 1.8x | 1.5x | 1.7x |
Income-Equity P/E Ratio Trailing | 14.2 | 17.2 | 17.7 | 12.6 | 12.8 | 16.7 | 14.0 | 13.6 | 14.5 | 15.2 | 14.0 |
S&P 500 P/E Trailing | 18.8 | 20.5 | 21.7 | 16.5 | 21.6 | 27.6 | 24.1 | 18.6 | 21.9 | 24.7 | 22.9 |
Premium/Discount | -24% | -16% | -18% | -23% | -41% | -40% | -42% | -27% | -34% | -38% | -39% |
Income-Equity (No MLPs) | |||||||||||
2015 | 2016 | 2017 | 2018 | 2019 | 2020 | 2021 | 2022 | 2023 | 2024 | 1Q2025 | |
Income-Equity (No MLPs) Yield | 4.6 | 3.9 | 3.7 | 4.2 | 3.6 | 3.5 | 3.2 | 3.5 | 3.4 | 3.4 | 3.6 |
S&P 500 Yield | 2.2 | 2.1 | 1.9 | 2.2 | 1.9 | 1.5 | 1.5 | 1.8 | 1.5 | 1.3 | 1.4 |
Ratio | 2.1x | 1.9x | 2.0x | 2.0x | 2.0x | 2.3x | 2.1x | 2.0x | 2.2x | 2.6x | 2.6x |
Income-Equity (No MLPs) Projected Dividend Growth* | 5.9 | 5.0 | 6.4 | 7.9 | 7.5 | 5.2 | 6.0 | 6.0 | 5.6 | 5.3 | 5.3 |
S&P 500 Projected Dividend Growth** | 4.2 | 4.0 | 4.2 | 5.2 | 4.2 | 3.3 | 5.9 | 4.8 | 4.5 | 5.3 | 5.1 |
Ratio | 1.4x | 1.2x | 1.5x | 1.5x | 1.8x | 1.5x | 1.0x | 1.3x | 1.2x | 1.0x | 1.0x |
Income-Equity (No MLPs) Dividend Coverage Ratio | 1.3x | 1.3x | 1.5x | 1.9x | 2.3x | 2.1x | 2.0x | 2.8x | 2.3x | 2.3x | 2.1x |
Income-Equity (No MLPs) Net Debt/EBITDA*** | 2.6x | 2.2x | 2.1x | 1.4x | 1.9x | 1.9x | 1.2x | 1.8x | 1.6x | 1.4x | 1.7x |
Income-Equity (No MLPs) P/E Ratio Trailing | 16.5 | 18.2 | 18.0 | 12.9 | 13.5 | 16.8 | 14.0 | 13.8 | 14.6 | 15.3 | 14.9 |
S&P 500 P/E Trailing | 18.8 | 20.5 | 21.7 | 16.5 | 21.6 | 27.6 | 24.1 | 18.6 | 21.9 | 24.7 | 22.9 |
Premium/Discount | -12% | -12% | -17% | -22% | -38% | -39% | -42% | -26% | -33% | -38% | -35% |
| As of March 31, 2025. Sources: Bloomberg; S&P; Miller/Howard Research & Analysis. The data above are based on representative accounts in our IncomeEquity portfolios both with and without MLPs and are subject to change. Median P/E ratio trailing is published for our Income-Equity portfolios. * Projected Dividend Growth—Miller/Howard Portfolio Team’s 3-year annualized projected dividend growth based on data from various sources, adjusted to reflect our view of future economic and market conditions. There is no assurance projections will be realized. ** Bloomberg Dividend per Share 3-year forward estimates. *** Excludes financials. Dividend yields shown for Miller/Howard portfolios exclude cash. All data are as of year-end, unless otherwise noted. Common stocks do not assure dividend payments. Dividends are paid only when declared by an issuer’s board of directors, and the amount of any dividend may vary over time. Dividend yield is one component of performance and should not be the only consideration for investment. See definitions and full disclosure on last page. |
How Do Dividend Stocks Perform in Down Years?
Stocks are off to a rough start this year, and while it is far too early to know how this year will end up, clients are asking how income strategies tend to perform in down markets.
Looking back at the last 50 years, the S&P 500 Index has had 9 down years. High-yield equities, defined as deciles 7 through 9 of dividend yields, outperformed the S&P 500 in 78% of the down years, and actually had positive absolute returns 44% of the time. Overall, high-yield stocks outperformed the S&P 500 by almost 10% during the down years.
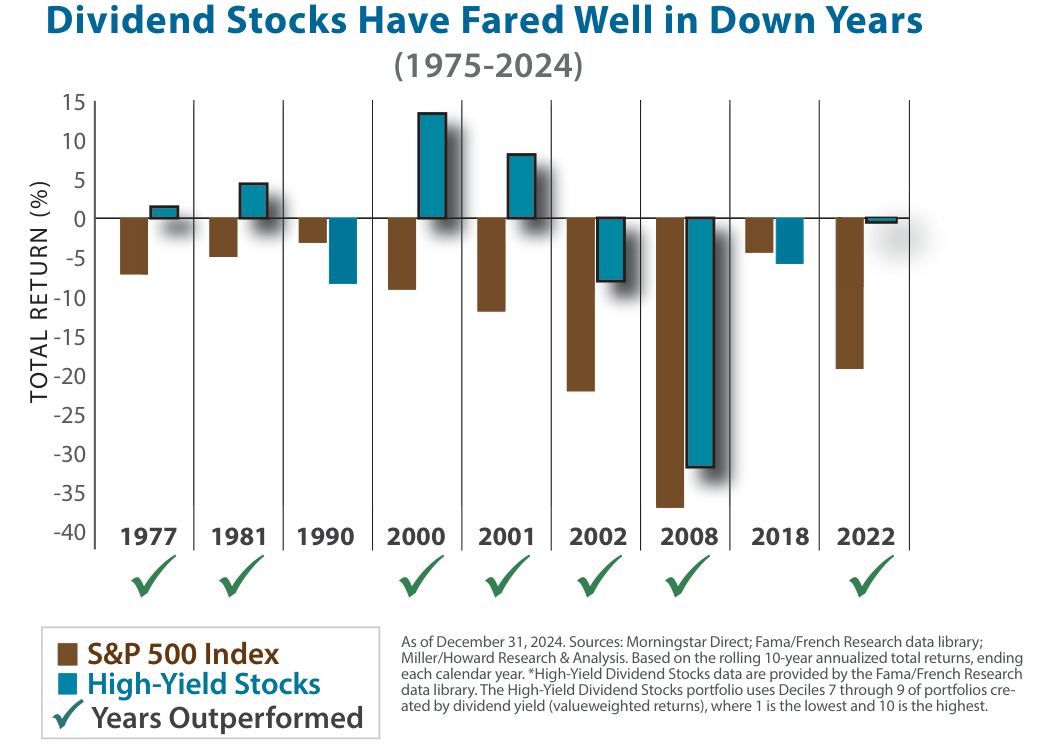
Of course, some equity income portfolios will do better, and some will do worse. What’s important is that we are searching for investment candidates from a pool that has historically provided downside protection.
While it’s gratifying to know that income stocks tend to outperform in down markets, our view continues to be that it’s best not to try to time the market. Fluctuations in the overall market are very unpredictable but typically buy-and-hold investors are well rewarded.
| INVESTMENT PRODUC TS: ARE NOT FDIC INSURED • MAY LOSE VALUE • ARE NOT BANK GUARANTEED The investment portfolios described herein are those of Miller/Howard Investments. These materials are being provided for illustrative and informational purposes only. The information contained herein is obtained from multiple sources that are believed to be reliable. However, such information has not been verified, and may be different from the information included in documents and materials created by the sponsor firm in whose investment program a client participates. Some sponsor firms may require that these Miller/Howard Investments materials are preceded or accompanied by investment profiles or other documents or materials prepared by such sponsor firms, which will be provided upon a client’s request. For additional information, documents and/or materials, please speak to your Financial Advisor. Miller/Howard Investments Inc. is an independent, research-driven investment boutique with over three decades of experience managing portfolios for major institutions and individuals in dividend-focused investment portfolios. The firm is 100% employee-owned through an Employee Stock Ownership Plan (ESOP). We continue to evolve and develop portfolios that strive to provide investorswith various levels of current income and dividend growth. With a primary goal of reliable income and long-term returns, coupled with a belief that investors can play an important role in securing a sustainable future, our portfolios include environmental, social, and governance research and/or screening, direct engagement with companies, filing shareholder resolutions, proxy voting, coalition building, and/or public policy involvement. This report represents Miller/Howard Investments’ views. The statistics and projections cited in this report have been provided by sources generally considered to be reliable, but are not guaranteed. Opinions and estimates offered constitute Miller/Howard Investments’ judgment and are subject to change without notice, as are statements of financial market trends, which are based on current market conditions. This material is solely informational. The information and analyses contained herein are not intended as tax, legal, or investment advice and may not be appropriate for your specific circumstances; accordingly, you should consult your own tax, legal, investment, or other advisors, at both the outset of any transaction and on an ongoing basis, to determine such appropriateness. The material may also contain forward-looking statements that involve risk and uncertainty, and there is no guarantee they will come to pass. Any investment returns—past, hypothetical, or otherwise—are not indicative of future performance. The information provided should not be considered a recommendation to buy or sell any security, and should not be considered investment, legal, or tax advice. Securities mentioned are being shown for informational purposes only. Buy and sell rationales are the express opinions of MHI’s investment team. These securities should not be considered a recommendation to buy, sell, or hold any of the securities and are not intended to imply that any one security listed above, or the portfolio as a whole, is appropriate for a particular client. There is no assurance that the securities purchased have remained or will remain in the portfolio or that securities sold have not been or will not be repurchased. To receive a list of all recommendations for the previous year, please email compliance@mhinvest.com. Common stocks do not assure dividend payments. Dividends are paid only when declared by an issuer’s board of directors, and the amount of any dividend may vary over time. Dividend yield is one component of performance and should not be the only consideration for investment. The returns on a portfolio that utilizes environmental, social, or governance (ESG) criteria for stock selection may be lower or higher than portfolios where ESG factors are not considered, and the investment opportunities available to such portfolios may differ. DEFINITIONS: High-Yield Stocks reflects a basket of the total returns for deciles 7, 8, & 9 as provided by Fama/French (value-weighted). Inflation is the year-over-year change of the Consumer Price Index for All Urban Consumers (CPI Index). Free Cash Flow Margin is free cash flow (defined as cash flow from operations minus capital expenditure) divided by revenue. Price-Earnings Ratio (P/E)—The ratio of a company’s share price to its earnings per share. The ratio is used as a valuation tool and can help determine whether a company is overvalued or undervalued. EBITDA= earnings before interest, taxes, depreciation, and amortization. MLP= Master Limited Partnership. S&P 500 Index® widely regarded as the best single gauge of large-cap US equities and serves as the foundation for a wide range of investment products. The Index includes 500 leading companies and captures approximately 80% coverage of available market capitalization. Russell 1000 Index® measures the performance of the large-cap segment of the US equity universe. It is a subset of the Russell 3000 Index® and includes approximately 1,000 of the largest securities based on a combination of their market cap and current index membership. The Russell 1000 Index® represents approximately 92% of market capitalization of the US market. Russell 1000 Value Index offers investors access to the broad value segment of US equity value universe and is constructed to provide a comprehensive and unbiased barometer of the broad value market.
As of March 31, 2025. Source: Morningstar Direct. Parentheses represent negative performance data. Results are shown in US dollars. Past performance is not indicative of future results. *Starting in 2021 net returns, unless otherwise indicated in red, are a simulation using a 0.75% annual fee, deducted monthly. MHI’s highest annual management fee as stated in our ADV is 0.75%. All net returns for periods prior to 2021 show a 1% annual fee. **Pro Forma 3% Net returns are a simulation of the effects of a bundled annual fee of 3%, deducted monthly, which would include advisor or consultant’s fees, transaction costs, and maintenance fees. MHI’s highest annual management fee as stated in our ADV is 0.75%. Note: Investment returns include the reinvestment of dividends and other income. The Dow Jones index is net of dividend withholding taxes. |
Editor's Note: The summary bullets for this article were chosen by Seeking Alpha editors.