This topic was last update here: Update For Equity REIT Basket Strategy As Of 4/22/16 - South Gent | Seeking Alpha
I discussed reasons for maintaining an allocation to REITs here: Update For Equity REIT Basket Strategy As Of 7/24/15 - South Gent | Seeking Alpha (scroll to "Why Own Equity REITs")
I discussed interest rate cycles and REITs here: Update For REIT Basket Strategy As Of 8/11/15/Interest Rate Cycles And REIT Stock Prices - South Gent | Seeking Alpha (scroll to "Interest Rate Movements and REIT Stocks")
I am tracking realized gains and losses, along with annual dividend payments, here:Gateway Post: Equity REIT Common and Preferred Stock Basket Strategy
Total Net Realized Gain Since September 2013 Inception: +$7,463.05 (of which $1,356.09 has been in equity preferred stocks)
During the life of this basket, I believe that dividend income will swamp realized gains and will generate over 70% of my total return.
All of the Canadian REITs make monthly distributions as does BRG, IRT and STAG. The rest pay quarterly.
I do include REIT cumulative preferred stocks in this basket: Advantages and Disadvantages of REIT Cumulative Equity Preferred Stocks (9/25/2009 Post).
Over the past several weeks, I have reduced my allocation to REITs and increased my allocation to regional banks based on my opinion that increases in inflation will trigger a greater than currently anticipated rise in interest rates.
As I become more concerned about a rise in rates, I will shift money out of REITs into my regional bank basket and vice versa when I believe rates will remain stable at abnormally low levels or decline. I consequently manage these two baskets in tandem as natural, though imperfect, hedges for one another. REIT and Regional Bank Baskets (3/20/2014 Post). I am concerned about directional changes in interest rates up or down and the potential decree of directional changes.
REITS performed poorly when the ten year treasury spiked from 1.66% to 3.04% during 2013. The regional bank ETF KRE had a 47.5% total return that year. When interest rates came back down in 2014, KRE had a total return of 1.85% (generated by the dividend payments), whereas the REIT ETF VNQ had a 30.36% total return.
I recently discussed selling 200 shares of a Canadian REIT here: Scroll to Portfolio Management 3. Sold 200 Northview Apartment at C$19.72: Update For Portfolio Positioning And Management As Of 4/29/16 - South Gent | Seeking Alpha
Basket as of 5/5/16:
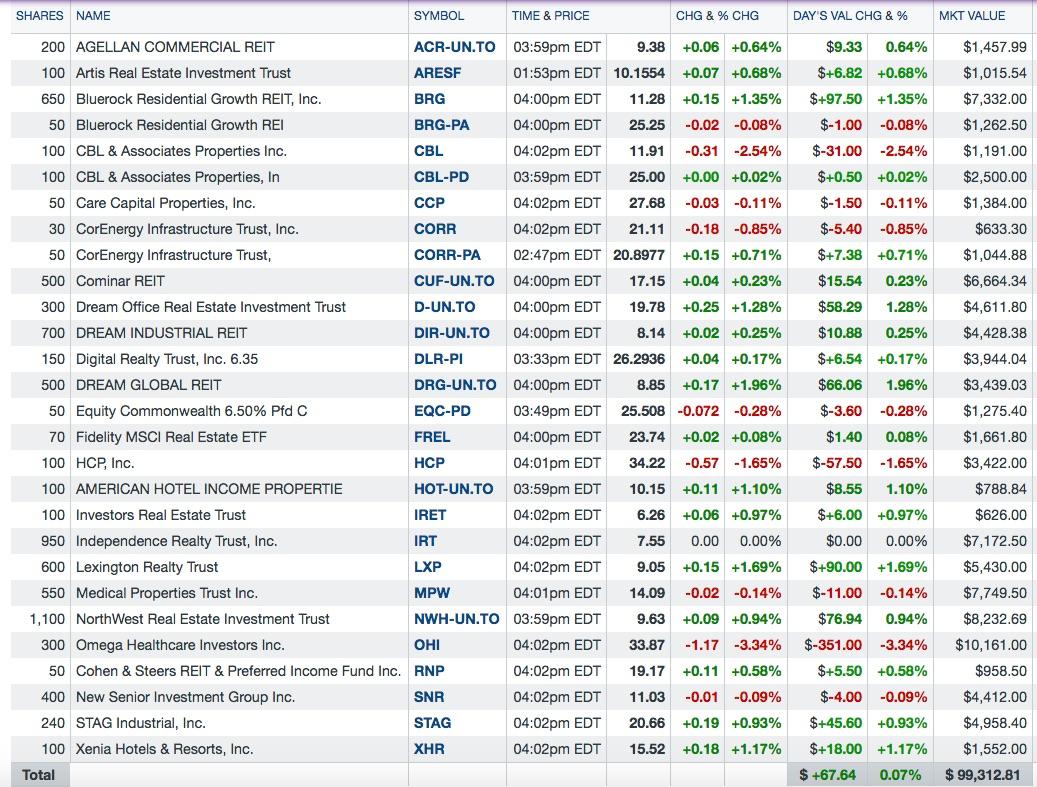
This basket will include equity REIT preferred stocks and foreign REIT stocks.
The basket slightly underperformed FREL and VNQ today due to the decline in OHI which is far more heavily weighted in this basket than in those ETFs.
FREL: $23.74 +0.02 (+0.08%): Fidelity MSCI Real Estate Index ETF (owned in the basket)
VNQ: $84.67 +0.25 (+0.30%) : Vanguard REIT ETF (recently sold)
OHI: $33.87 -1.17 (-3.34%): Omega Healthcare Investors
OHI currently has a .67% weighting in FREL. The weighting in my basket is close to 10%.
+++++++++
1. Added 100 NWN.UN at C$9.58: This last purchase brings my position up to 1,100 shares.
Quote: Northwest Healthcare Properties Real Estate Investment Trust (NWH.UN:TOR)
Company Description: This REIT has a diversified portfolio of 122 health care properties with 8 million gross leasable space. Of those 122 properties, 70 are located in Canada and the remainder in Brazil, Germany, Australia and New Zealand. Northwest is the largest private owner of healthcare properties in Canada. Company Profile
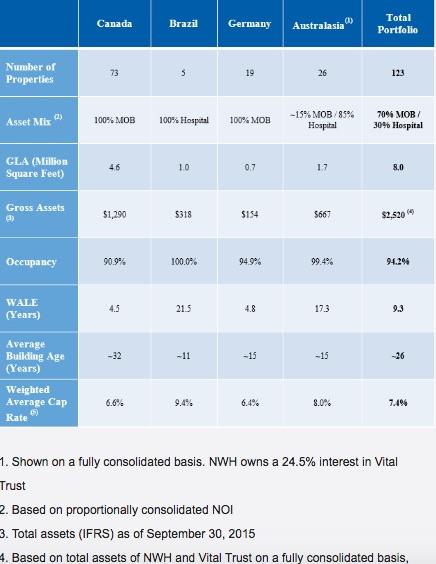
Map and Pictures of Properties
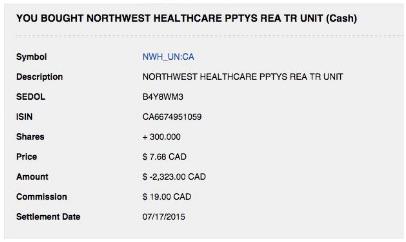
Trade Snapshot: ($1 Commission)

This REIT can be purchased in the dark U.S. Grey Market using USDs. NWHUF Northwest Healthcare Properties Real Estate Investment (NWHUF) I personally would not buy a security in that market, where bid/ask prices are not displayed, liquidity is non-existent or close to it, and the investor has to use a limit order derived by first converting the ordinary share price into USDs.
Last Discussed Here: Update For Equity REIT Basket Strategy As Of 7/24/15 - South Gent | Seeking Alpha (Bought 300 at C$7.68)
The Fidelity commission was C$19 vs. C$1 for IB.
I will be gradually moving my Canadian REIT positions from Fidelity to my Interactive Broker account.
Recent Unit Offering: I thought that the market absorbed this offering in a beneficial way to existing unitholders. This REIT just sold 7,532,500 units at $9.2 per unit.
Dividend: This REIT is currently paying a monthly distribution of C$.06667 per unit. At that rate, the dividend yield is about 8.35% at a total cost per share of C$9.58 per share.
Recent Earnings Report: The last earnings report was for the Q/E 12/31/16. Northwest Healthcare Properties Real Estate Investment Trust Releases Fourth Quarter 2015 Results
More detailed information about quarterly results can be downloaded at this REIT's website: Quarterly & Other Reports - Investor Information - Northwest Healthcare Properties
The AFFO payout ratio was 98% in 2015.
The 2016 1st quarter report is scheduled for release on 5/12.
Recent News: NorthWest Healthcare Properties REIT Completes Acquisition of German Medical Office Building
I do view this REIT as a potential acquisition candidate for a larger U.S. healthcare REIT looking to expand internationally.
2. Sold 100 of 650 MPW at $14 (highest cost lot) Roth IRA: I had a GTC AON limit order to sell my highest cost 101+ share lot at $14.
Profit Snapshot:
![]()
Closing Price Day of Trade: MPW: $14.11 +0.54 (+3.98%) (new 52 week hit intra-day at $14.19)
This lot was purchased on 5/15/2015 at $13.807.
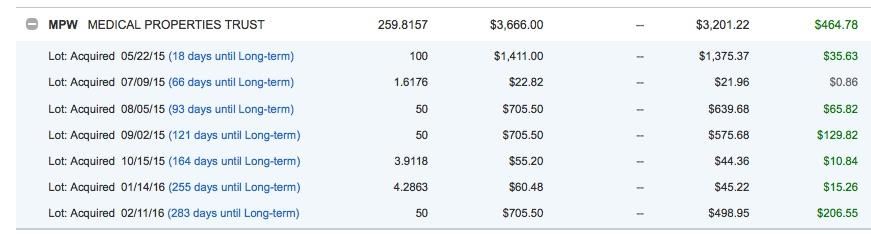
Of the remaining 550 shares, the largest unrealized gain is this lot held in my Schwab taxable account:
![]()
The second largest unrealized gain is in a satellite taxable account that was opened and linked to an online savings account that was used to purchase bank CDs before their rates became unacceptable to me. As the CDs matured, I used the proceeds to buy dividend paying stocks. So far, that has paid off handsomely. When and if the worldwide CB Jihad Against the Savings Class ends, hopefully before I meet the Great Stock Jock in the Sky, I will start buying CDs again using a ladder strategy.
This account contains my second highest cost lot, purchased in May 2015, which will be sold as my next pare.
I have quit reinvesting the dividends in this account, taking my last distribution in cash:
![]()
The foregoing describes a standard trading system that I utilize, where lots are purchased over time, the highest cost lots are jettisoned profitably, and the average cost per share declines as lower price shares are kept until the position is eliminated. The selling of the highest cost lot is the most cost effective from a tax viewpoint while harvesting a profit that increases the total return and lowering the average cost per share.
Dividends: MPW is currently paying a quarterly dividend of $.22 per share. Medical Properties Trust, Inc. - Dividend Information
Most Recent Discussions:
Item # 4. Added 50 MPW at $9.84-Satellite Taxable Account: UPDATE For Equity REIT Basket Strategy As Of 2/12/16 - South Gent | Seeking Alpha
I made the following comment in that post:
"I would agree with Buffett that the herd's price may have nothing to do with the intrinsic and fundamental value of the shares.
"In the short term, the market is a popularity contest. In the long term, the market is a weighing machine."
This one is worthy of a repeat as well:
"Successful Investing takes time, discipline and patience. No matter how great the talent or effort, some things just take time: You can't produce a baby in one month by getting nine women pregnant." (rb has to ask why not?)
It gets back to Ben Graham's Voting and Weighing Machine analogy."
Item # 3. Averaged Down: Bought 100 MPW at $10.42: Update For Equity REIT Basket Strategy As Of 1/21/16 - South Gent | Seeking Alpha
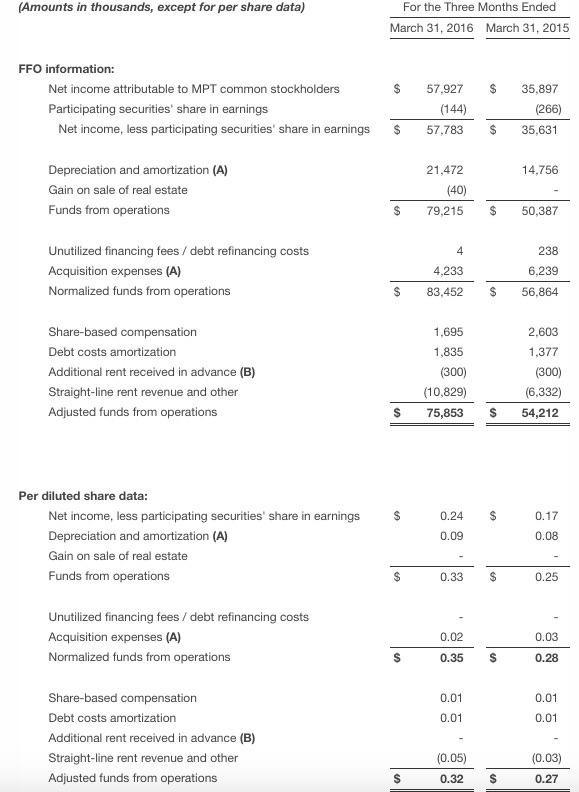
Recent Earnings Report: Medical Properties Trust, Inc. Reports 25% Growth in First Quarter Normalized FFO to $0.35 Per Share
The shares popped 3.98% in response to this report.
CEO Edward Aldag on Q1 2016 Results - Earnings Call Transcript | Seeking Alpha
Prior Round Trips:
Sold 100 MPW at $14-Regular IRA (9/13/14 Post)(profit snapshot=$108.27-total return 10% in five months)- Item # 2 Bought Regular IRA-100 MPW at $12.76 (4/18/14 Post)
Item # 6 Sold 100 MPW at $12.25 (1/3/13 Post)(snapshot of profit=$221.08 & total return calculated at $321.08).Item # 3 Bought 100 MPW at $9.9-ROTH IRA (2/13/12 Post)
Trading Profits to Date=$346.71 (excludes dividends)
++++
Miscellaneous:
1. Medical Properties Trust (MPW) Reports 25% Growth in First Quarter Normalized FFO to $0.35 Per Share ("Normalized Funds from Operations ("FFO") per diluted share was $0.35 in the first quarter, up 25% compared to $0.28 per share reported in the first quarter of 2015")
2. STAG Industrial (STAG) Announces First Quarter 2016 Results ("$0.39 of Core FFO per diluted share for the first quarter of 2016, an increase of 11.4% compared to the first quarter ended March 31, 2015. For the quarter ended March 31, 2016, Core FFO increased 17.0% in the aggregate compared to the same period last year.")
3. Dream Industrial REIT Announces Stable First Quarter Financial Results (" Adjusted Funds From Operations ("AFFO") per unit was stable at 20 cents compared to the three months ended March 31, 2015 and decreased by 0.5 cents compared to the three months ended December 31, 2015. . . In-place occupancy of 93.5% compared to 93.4% at December 31, 2015 and 94.2% at March 31, 2015. Total occupancy at March 31, 2016, including over 201,000 square feet in committed occupancies, was at 94.7%. To date, commitments have been obtained for over 70% of the total 3.0 million of expiring leases and terminations in 2016.")
4. Independence Realty Trust (IRT) Announces First Quarter 2016 Financial Results ("Core Funds from Operations ("CFFO") per share increased 11% to $0.21 for the quarter ended March 31, 2016 from $0.19 for the quarter ended March 31, 2015 . . IRT reaffirms its estimate and underlying assumptions that 2016 full year CFFO per diluted share will be in a range of $0.82-$0.88 per common share ")
5. Omega (OHI) Announces First Quarter 2016 Financial Results; Adjusted FFO of $0.83 Per Share for the First Quarter ("for the three-month period ended March 31, 2016 Funds From Operations ("FFO") of $153.6 million or $0.77 per common share and Funds Available For Distribution ("FAD") of $148.5 million or $0.75 per common share." Adjusted FFO was $.83 per share)
7. New Senior Announces First Quarter 2016 Results (Normalized Funds Available for Distribution ("Normalized FAD") of $21.8 million, or $0.26 per basic and diluted share, an increase of 30% vs. 1Q'15; AFFO of $23.9 million, or $0.29 per basic and diluted share, an increase of 32% vs. 1Q'15; Normalized Funds from Operations ("Normalized FFO") of $26.5 million, or $0.32 per basic and diluted share, an increase of 19% vs. 1Q'15; the Company's Board of Directors declared a cash dividend of $0.26 per share for the quarter ended March 31, 2016. The dividend is payable on June 22, 2016 to shareholders of record on June 8, 2016.)
8. City Office REIT Reports First Quarter 2016 Results (CoreFunds From Operations ("Core FFO") was $5.2 million, or $0.32 per fully diluted share; Adjusted Funds From Operations ("AFFO") was $3.6 million, or $0.22 per fully diluted share; after 3/31/16, raised total gross proceeds of $91.8 million in a public follow-on offering of 8,050,000 shares of common stock, including the full exercise of the underwriters' overallotment option; declared a cash dividend of $0.235 per share which was paid on April 19, 2016; in-place and committed occupancy closed the quarter at 93.2%
9. Lexington Realty Trust Reports First Quarter 2016 Results (company FFO of $.3 per share up from $.26; repurchased 1.2M shares at an average cost of $7.56 per share; FAD at $.24 per share, up from $.23)
10. Dream Office REIT Reports First Quarter Results and Solid Progress on Three-Year Plan (FFO per diluted share=C$.68; Net Asset Value per share=C$30.31)
11. Cominar Pursues its Capital Optimization Strategy ("Recurring funds from operations amounted to $68.8 million, while recurring funds from operations per unit fully diluted(1)amounted to $0.41 for the first quarter of 2016.")
12. Care Capital Properties (CCP) Reports First Quarter Results (Normalized Funds from Operations ("FFO") for the quarter ended March 31, 2016 was $67 million, or $0.80 per diluted common share. . . . Normalized Funds Available for Distribution ("FAD") for the quarter ended March 31, 2016 was $64 million, or $0.77 per diluted common share, an increase of 6.6 percent compared to the first quarter of 2015. This increase is primarily attributed to a decrease in routine capital expenditures and transaction costs.")
Disclaimer: I am not a financial advisor but simply an individual investor who has been managing my own money since I was a teenager. In this post, I am acting solely as a financial journalist focusing on my own investments. The information contained in this post is not intended to be a complete description or summary of all available data relevant to making an investment decision. Instead, I am merely expressing some of the reasons underlying the purchase or sell of securities. Nothing in this post is intended to constitute investment or legal advice or a recommendation to buy or to sell. All investors need to perform their own due diligence before making any financial decision which requires at a minimum reading original source material available at the SEC and elsewhere. A failure to perform due diligence only increases what I call "error creep". Stocks, Bonds & Politics:ERROR CREEP and the INVESTING PROCESS. Each investor needs to assess a potential investment taking into account their personal risk tolerances, goals and situational risks. I can only make that kind of assessment for myself and family members.