
John M Lund Photography Inc
A comfortable, prosperous, or even rich retirement is something we all dream of. The ability to sleep well at night, knowing that each day brings hope, joy, and a fulfilling existence full of friends, family, and all the passions that make life worth living.
If you don't find a way to make money while you sleep, you will work until you die.” - Warren Buffett
Passive income, like Social Security or a pension, is a wonderful thing in retirement. But if you don't have access to a pension or Social Security isn't high enough to meet your lifestyle goals, dividend income from investments is a way to fill the gap.
Triple Compounding: The Secret To Maximizing Long-Term Income In Retirement
Many investors think high-yield blue chips, like those I frequently write about, are the best way to retire rich and live richly in retirement.
While they're an essential tool in one's arsenal of prosperity, high-yield blue chips alone are not the optimal strategy for most investors.
A married couple in retirement has a 36% chance that one of the partners will live to 100.
That means that even if you're retired and 70, you and your spouse need to plan as if you had an investing time horizon of 30 to 40 years.
This means that almost every investor has a 50-plus year time horizon, which is both remarkable and daunting.
It's daunting because humans struggle to plan out that long. After all, the power of triple compounding can transform such timeframes.
What's triple compounding? It harnesses the power of high-yield dividends and growth blue chips to generate maximum long-term income.
- Dividends grow exponentially over time.
- Dividends are reinvested into exponentially more shares over time.
- Annual Rebalancing lets the growth stocks buy you more income stocks than you could ever hope to buy with savings alone.
Triple income compounding is why long-term income growth closely tracks total returns over time.
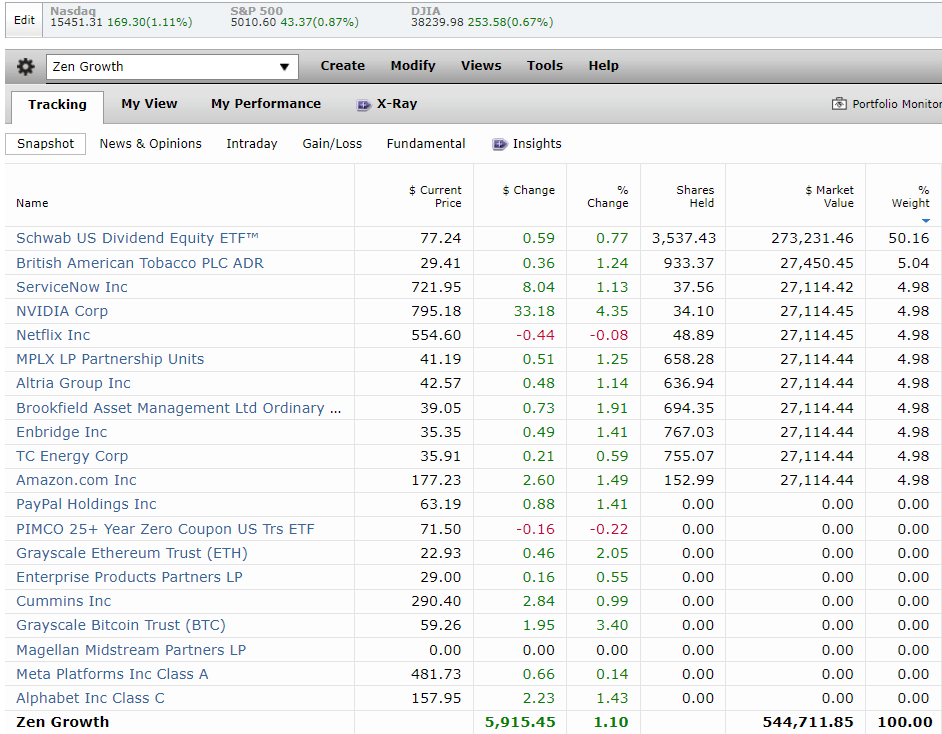
Here's an example of how to build a prudent, sleep well at night or SWAN high-yield diversified portfolio using 10 blue-chip stocks and one gold-standard high-yield ETF, Schwab's U.S. Dividend Equity ETF (SCHD).
The Zen Growth Portfolio: Maximizing Long-Term Income Growth With Low Risk

Sharesight
The Zen portfolio strategy is 50% ETF and 50% individual stocks, which combines diversification and risk management with maximizing whatever goal you have.
For example, maximizing total returns is important if total returns drive income growth over time. Augmenting ETFs with individual stocks is a great way to boost yield, growth, low valuation, quality, etc., whatever you seek to maximize.
This article is an explanation of the annual Zen Growth Portfolio, which seeks to maximize not just attractive yield today, but also long-term income growth over time.
Proof That Triple Compounding Works
I'll show you what these five high-yield companies and growth stocks are in a moment, but first, let me show you the power of triple compounding at work.
Historical Returns Since 2002
While historical returns don't guarantee future results, we can prove that two points of income growth closely track total returns, and thus, this is something that even older investors should focus on.
And get the extra income that high-yield plus growth compared to high yield alone could generate over 22 years.

Portfolio Visualizer
There were far better returns, to be sure, though with noticeably higher volatility. The Great Recession resulted in lower volatility than the S&P and lower than even the 60% stock and 40% bond retirement portfolio.
- -44% peak decline for the 60-40 during the Great Recession.

Portfolio Visualizer
Note the lower volatility, which resulted in the worst three-year return being slightly positive, compared to each individual strategy or S&P 500 suffering negative returns.
- Look at the lowest rolling returns to see "just how much suffering investors had to endure to see those impressive gains."
And what about income growth?
Income Growth: 24% Over 22 Years = 97X Income Growth

Portfolio Visualizer
Cumulative Dividends Per $1,000 Initial Investment
| Metric | 5 High-Yield Blue-Chips | 5 High-Yield Blue-Chips + 5 Growth Blue-Chips |
| Total Dividends | $7,221 | $19,087 |
| Total Inflation-Adjusted Dividends | $3,840.96 | $10,152.66 |
| Annualized Income Growth Rate | 13.3% | 24.4% |
| Total Income/Initial Investment % | 7.22 | 19.09 |
| Inflation-Adjusted Income/Initial Investment % | 3.84 | 10.15 |
| More Inflation-Adjusted Income Than High-Yield Blue-Chips Alone | 2.64 | NA |
| Starting Yield | 5.8% | 3.2% |
| Today's Annual Dividend Return On Your Starting Investment (Yield On Cost) | 79.7% | 311.6% |
| 2024 Inflation-Adjusted Annual Dividend Return On Your Starting Investment (Inflation-Adjusted Yield On Cost) | 42.4% | 165.7% |
(Source: Portfolio Visualizer Premium)
Investing into the five high-yield blue chips in this article resulted in income growth of 13% for 22 years, turning a 5.8% yield in 2022 into an 80% yield on cost in 2024.
Adjusted for inflation, the yield on cost is now 42%, and cumulative inflation-adjusted dividends were 7X the initial investment.
However, combined with this article's five growth blue chips, the income growth rate almost doubled, and cumulative inflation-adjusted income was almost 3X greater.
Remember that most investors have a 50-plus year time horizon for retirement planning purposes because retired couples must plan for living beyond 100.
Imagine the difference in inflation-adjusted income that 50-plus years would compound to. Can you see why I combine high-yield with high-quality, reasonably priced premium growth names?
11 Blue Chips For A 4% Yielding Sleep Well At Night Dividend Growth Portfolio Video
Schwab's U.S. Dividend Equity ETF (SCHD) is the core of this high-yield, sleep-well-at-night ZEN portfolio.
SCHD has been in the top 1% of its peers since inception due to the factors I discuss in this article, including the four screening criteria that lead to an incredible combination of yield, quality, growth, and value.
50% of the portfolio is SCHD, which gives exposure to 100 high-quality, high-yield blue chips.
- Not all of SCHD's holdings are worth owning, see risk section.
What about the 10 individual blue chips?
| Zen Terminal Screening Criteria | Companies Remaining | % Of Master List | |
| 1 | Add "12 month fundamentally justified upside" Under "Columns" | 0.00% | |
| 2 | BHS Rating "reasonable buy, good buy, strong buy, very strong buy, ultra value buy" | 331 | 65.94% |
| 3 | Quality Rating 10+ (Blue-Chip Or Better) | 321 | 63.94% |
| 4 | Investment Grade Credit Rating (BBB- or higher) | 241 | 48.01% |
| 5 | Non-Speculative | 231 | 46.02% |
| 6 | LT Total Return Potential 10+% | 152 | 30.28% |
| 9 | Sort By Yield/total return consensus | 5 | 1.00% |
| 10 | Top 5 Total Return and Top 5 High-Yield Combined using "Ticker" and individual tickers. | 16 | 3.19% |
| Total Time | 2 minutes |
Screening for both high yield and high growth is easy if you start with a core-quality screen.
I always like to focus on reasonably attractively priced, blue-chip quality companies that are non-speculative (non-distressed) and offer a consensus double-digit long-term return (and income growth) according to the FactSet consensus.
Then, you can sort by whatever fundamental metric you care about, in this case yield, and long-term total return potential.
That creates two mini-screens of five companies each.
5 High-Yield Blue Chips

Dividend Kings Zen Research Terminal
8.6% yield, 21% discount to historical fair value, with Ultra Sleep-Well-At-Night quality and safety (think wide moat aristocrats).
S&P estimates long-term risk management in the top 23% of all global companies based on over 1,000 risk metrics and a 6% 30-year bankruptcy risk for a BBB+ stable average credit rating.
The consensus for long-term earnings/dividend growth is 5% to 6%, and the consensus for long-term total return is 14%, meaning 14% long-term income growth is expected, similar to the 13% of the last 22 years.
5 High Growth Blue Chips

Dividend Kings Zen Research Terminal
0.8% yield on the hyper-growth blue chips, a 27% discount to historical fair value, and 89% safety and quality (Ultra SWAN quality).
According to S&P, long-term risk management is in the top 18% of all global companies with A-credit ratings and a 42% upside to fair value potential within 12 months.
- It's not a forecast.
- Fundamentally justified total return potential means "If a company goes up X% within 12 months, it's 100% justified by fundamentals."
27% consensus long-term growth for a 28.1% long-term total return and income growth potential.
So what happens when we combine high-yield and high-growth blue chips?
10 Max Long-Term Income Growth Blue Chips

Dividend Kings Zen Research Terminal
4.7% yield is three times more than the S&P 500, much higher than Vanguard's high-yield ETF (VYM) and even higher than SCHD's 4%.
24% discount to historical fair value, compared to a 1% premium for the S&P.
90% Ultra SWAN quality, S&P risk management in the top 21% of global companies and a BBB+ stable average credit rating.
16% long-term growth consensus and a 40% upside to fair value within 12 months.
If these 10 stocks are up 40% in 12 months, current consensus fundamentals would completely justify that.
Long-term income growth consensus? 21%, similar to the 24% of the last 22 years.
Consensus 2026 Total Return Potential
- Not a forecast
- Consensus Return potential.
- These are the expected returns if and only if these companies grow as expected and return to historical fair value by the end of 2026.
- Fundamentals would justify that.
2026 Consensus Total Return Potential:
- S&P: 13.2% CAGR = 45%
- These 10 blue chips: 29.9% CAGR = 119%
British American Tobacco (BTI)

FAST Graphs, FactSet
Altria (MO)

FAST Graphs, FactSet
MPLX (MPLX) - K1 Tax Form

FAST Graphs, FactSet
TC Energy (TRP)

FAST Graphs, FactSet
Enbridge (ENB)

FAST Graphs, FactSet
ServiceNow (NOW)

FAST Graphs, FactSet
Amazon (AMZN)

FAST Graphs, FactSet
Netflix (NFLX)

FAST Graphs, FactSet
NVIDIA (NVDA)

FAST Graphs, FactSet
Brookfield Asset Management (BAM)

FAST Graphs, FactSet
Putting It All Together: ETFs + Yield + Growth
Morningstar
The ZEN Growth Portfolio is a balance of yield, value, and growth designed for optimal income growth over time.

Morningstar
FactSet expects 16% to 17% long-term income growth from this portfolio, and Morningstar is more conservative, estimating 14%.
But that's still excellent. SCHD delivered 13% historical returns and was in the top 1% of high-yield ETFs. 14% long-term returns and income growth would be even better.
A 14.5 PE ratio, 10X adjusted for cash on the balance sheet, means a cash-adjusted PEG ratio of 1.0. That's Peter Lynch's growth at a reasonable price or GARP.

Morningstar

Morningstar
You can see the diversification benefits of combining a wonderful ETF with individual companies.
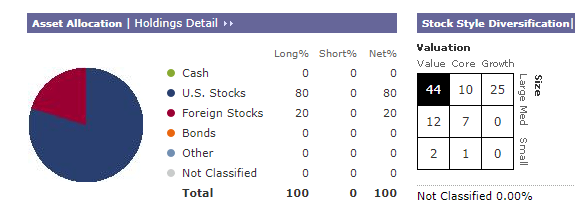
Morningstar
Instant diversification, including geographical and investing style.
Morningstar
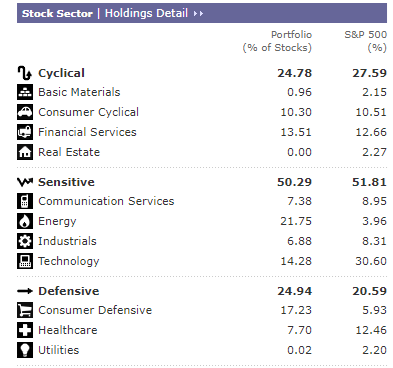
Every sector except REITs, with no sector more than 22%. 10% of that is ENB and TRP, the most utility-like midstreams, both dividend champions with 25-plus year dividend growth streaks.
Historical Returns Since 2011

Portfolio Visualizer

Portfolio Visualizer
Advanced Metrics

Portfolio Visualizer
SCHD and VIG have had similar volatility-adjusted return metrics compared to the S&P since 2011. Zen Growth did much better, including 5% annual alpha.

Portfolio Visualizer
A conditional value at risk of 5% is basically "a bad month during a bear market" for a portfolio. The S&P has historically had 10% long-term CVAR and 9% in the last 13 years.
Downside capture is the percentage of the market's downside over time that a portfolio captures and the percentage of upside gains.
So Zen Growth historically falls 91% as much as the S&P while rising 113%.
SCHD captures 87% of the market's downside with 88% of the upside.
21% Annual Income Growth For 12 Years

Portfolio Visualizer
Zen Growth Portfolio: 21% annual income growth.
SCHD: 15% annual income growth.
VIG: 10% annual income growth.
Risks To Consider
Anytime you buy an individual stock, you risk fundamentals deteriorating over time.
When the facts change, I change my mind. What do you do sir?" - John Maynard Keynes
Every recommendation I make is a snapshot in time. I shift my recommendation when the fundamentals shift, as any smart analyst would.

Wide Moat Research
This is why ETFs are a great starting point for most investors.
Because 44% of US stocks from 1980 to 2022 suffered what JPMorgan called "permanent catastrophic" declines of 70% or more.
They fell 70% or more and then never recovered to new record highs.

Ritholtz Wealth Management
From 1926 to 2018, 60% of US stocks delivered negative returns, and 2% generated all cumulative net profits, including 5% from Apple (AAPL) alone.
Even if you do happen to own the big winners, the volatility you'll have to endure can be intense.
5 High-Yield Blue-Chip Worst Monthly Returns
| Year | Month | 5 High-Yield Blue-Chip Return | 5 Growth Blue-chip Return | S&P Return |
| 2020 | 3 | -13.09% | -5.62% | -12.37% |
| 2008 | 11 | -11.95% | -15.63% | -7.17% |
| 2022 | 9 | -10.81% | -11.59% | -9.22% |
| 2018 | 2 | -10.47% | 1.53% | -3.69% |
| 2022 | 6 | -10.37% | -13.57% | -8.27% |
(Source: Portfolio Visualizer Premium)
5 Growth Blue-Chip Worst Monthly Returns
| Year | Month | 5 High-Yield Blue-Chip Return | 5 Growth Blue-chip Return | S&P Return |
| 2022 | 4 | -1.69% | -27.31% | -8.73% |
| 2004 | 7 | -0.83% | -23.74% | -3.31% |
| 2008 | 10 | -10.18% | -23.65% | -16.79% |
| 2018 | 10 | -1.83% | -19.09% | -6.85% |
| 2011 | 9 | -3.53% | -18.66% | -7.04% |
(Source: Portfolio Visualizer Premium)
Growth stocks can be so volatile they can suffer a bear market in a single month.
If you can't stomach such volatility, you can't be 100% growth stocks. Something many investors sadly learn the hard way after a prolonged growth rally.
Monthly Returns Since 2002
| Year | 5 High-Yield Blue-Chip Return | 5 Growth Blue-chip Return | S&P Return |
| Min | -13.09% | -27.31% | -16.79% |
| Max | 16.54% | 33.84% | 12.81% |
| Median | 1.02% | 3.12% | 1.37% |
| Average | 1.02% | 3.12% | 1.37% |
Mode (Most Frequent) | 1.06% | 3.28% | 1.38% |
(Source: Portfolio Visualizer Premium)
And what if you do use value, growth, and ETFs to reduce volatility?

(Source: Portfolio Visualizer Premium)
There's still plenty of volatility.
Any pure stock portfolio will sometimes suffer high volatility. You have to be willing to live through months like this.
10 Worst Monthly Returns For Zen Growth
| Year | Month | SCHD Return | VIG Return | Zen Growth Return | S&P 500 Return |
| 2020 | 3 | -11.89% | -9.62% | -10.38% | -12.37% |
| 2018 | 10 | -5.91% | -6.36% | -9.68% | -6.85% |
| 2022 | 6 | -7.95% | -6.23% | -9.66% | -8.27% |
| 2022 | 9 | -7.40% | -8.18% | -9.17% | -9.22% |
| 2018 | 12 | -8.13% | -8.73% | -9.05% | -9.04% |
| 2022 | 4 | -4.12% | -5.12% | -8.43% | -8.73% |
| 2019 | 5 | -7.60% | -4.63% | -7.87% | -6.36% |
| 2023 | 9 | -4.20% | -4.26% | -6.62% | -4.78% |
| 2020 | 2 | -9.35% | -8.34% | -5.96% | -8.24% |
| 2024 | 4 | -4.20% | -3.89% | -5.33% | -4.58% |
(Source: Portfolio Visualizer Premium)
10 Best Monthly Returns For Zen Growth
| Year | Month | SCHD Return | VIG Return | Zen Growth Return | S&P 500 Return |
| 2020 | 4 | 12.61% | 9.88% | 12.02% | 12.81% |
| 2020 | 11 | 13.17% | 10.04% | 11.51% | 10.94% |
| 2015 | 10 | 8.76% | 6.74% | 10.45% | 8.42% |
| 2019 | 1 | 6.05% | 6.32% | 9.82% | 8.00% |
| 2023 | 11 | 6.30% | 7.47% | 9.73% | 9.12% |
| 2022 | 10 | 11.21% | 9.96% | 9.37% | 8.08% |
| 2013 | 1 | 5.54% | 5.93% | 8.79% | 5.18% |
| 2021 | 3 | 8.94% | 6.03% | 7.95% | 4.37% |
| 2016 | 3 | 6.40% | 6.28% | 7.89% | 6.78% |
| 2020 | 8 | 5.12% | 6.16% | 7.55% | 7.18% |
(Source: Portfolio Visualizer Premium)
Monthly Return Summary Since 2011
| Metric | SCHD Return | VIG Return | Zen Growth Return | S&P 500 Return |
| Average | 1.08% | 1.03% | 1.54% | 1.16% |
| Median | 1.45% | 1.53% | 2.00% | 1.82% |
| Min | -11.89% | -9.62% | -10.38% | -12.37% |
| Max | 13.17% | 10.04% | 12.02% | 12.81% |
| Mode (most common) | 2.85% | 2.37% | 3.46% | -1.59% |
(Source: Portfolio Visualizer Premium)
Do you want to know the key to true happiness in the stock market? It knows your personal volatility threshold for average bear markets.
Since 2000 here's the average peak decline of various asset allocations.

Portfolio Visualizer, KraneShares, Soc Gen
Hedges = 50% long bonds and 50% managed futures.
Stocks = S&P 500.
If you can sleep well at night with a 15% peak decline in bear markets but 34% (historical S&P average) causes you to panic sell, then you should be 70% stocks and 30% hedges.
That's your optimal asset allocation for your emotional wellbeing.
Bottom Line: If You Want Maximum Income In Retirement, You Have To Remember About Growth
It's easy to think that a low-risk 5% portfolio or even 6% or 7% (as you can build depending on your risk profile) is all you need.
And perhaps that's what works best for you. But if maximum low-risk, long-term income in retirement is the goal, then total returns matter, and they matter a lot.
As I just showed you, over 22 years, combining high yield with high growth resulted in almost 3X more cumulative inflation-adjusted income.
And that's just 22 years. Remember that 36% of retired couples will have someone live to 100-plus, meaning that even those retiring today at 65 should be planning for 40 to 50 years.
By bar-belling high-yield with growth and then adding gold-standard ETFs like SCHD or any other high-quality ETF, you can build an optimized sleep-well-at-night portfolio that's perfect for your needs.
Not just your financial goals, but your emotional needs, too.
Remember that even God's own investing strategy will fail if you panic sell during bear markets.
My biggest passion is empowering people like you to use the right tools, companies, and asset classes to build your perfect portfolio.
So you can harness the genius of global capitalism to live your dreams.
You can trust the world's best company executives and their armies of skilled employees to work hard for you so that you won't have to one day.
----------------------------------------------------------------------------------------

Dividend Kings helps you determine the best safe dividend stocks to buy via our Automated Investment Decision Tool, Zen Research Terminal, Correction Planning Tool, and Daily Blue-Chip Deal Videos.
Membership also includes
- Access to our 13 model portfolios (all of which are beating the market in this correction)
- my family's $2 real-money fund.
- 50% discount to iREIT (our REIT-focused sister service)
- real-time chatroom support
- real-time email notifications of all my retirement portfolio buys
- numerous valuable investing tools
Click here for a two-week free trial so we can help you achieve better long-term total returns and your financial dreams.