Elen11
With rates increasing and the dollar strengthening, we have seen early signs of the market tightening financial conditions as inflation runs hot while the disinflation process stalls.
Jay Powell will likely repeat his last message that the disinflation process has stalled at this week's FOMC meeting. The latest PCE report shows some troubling signs as PCE super core accelerates to its fastest pace since January 2023.
This week will be loaded with job data, starting Tuesday with the employment cost index for the first quarter and ending Friday with the BLS employment situation report. This week's data will tell us whether higher yields and a stronger dollar will continue or if the current trends have gone too far and will need to unwind.
The technicals in rates and the dollar suggest that both still have much higher to climb and that the recent trend in financial conditions tightening has only started. But of course, the Wednesday FOMC meeting will give the market the green light to go ahead or pause on conditions, giving equities the signal to go higher or lower.
Data Dump
The employment cost index will be released on April 30 and is expected to rise to 1% on a Quarter-over-Quarter Seasonal Adjusted Annualized Rate in the first quarter, up from 0.9% in the fourth quarter. That will be followed by the ADP Employment Change report on May 1, which is expected to show 180,000 jobs created in April, down from 184,000 in March. Meanwhile, the JOLTS report, also on Wednesday, is expected to show job openings in March fell to 8.68 million from 8.76 million in February. Also, on Wednesday, the ISM manufacturing report will be presented, which is expected to show that the sector remains in expansion but declines to 50.1 from 50.3. But more importantly, the ISM prices paid index is expected to decline to 55.2 from 55.8.
Indeed, job posting data shows that fewer job openings continued from March into April, while the NFIB job openings that were hard to fill remained at the lower end of the range. This would imply that the decline in JOLTS has likely consistently declined, indicating that the labor market continues to loosen.
Bloomberg/Indeed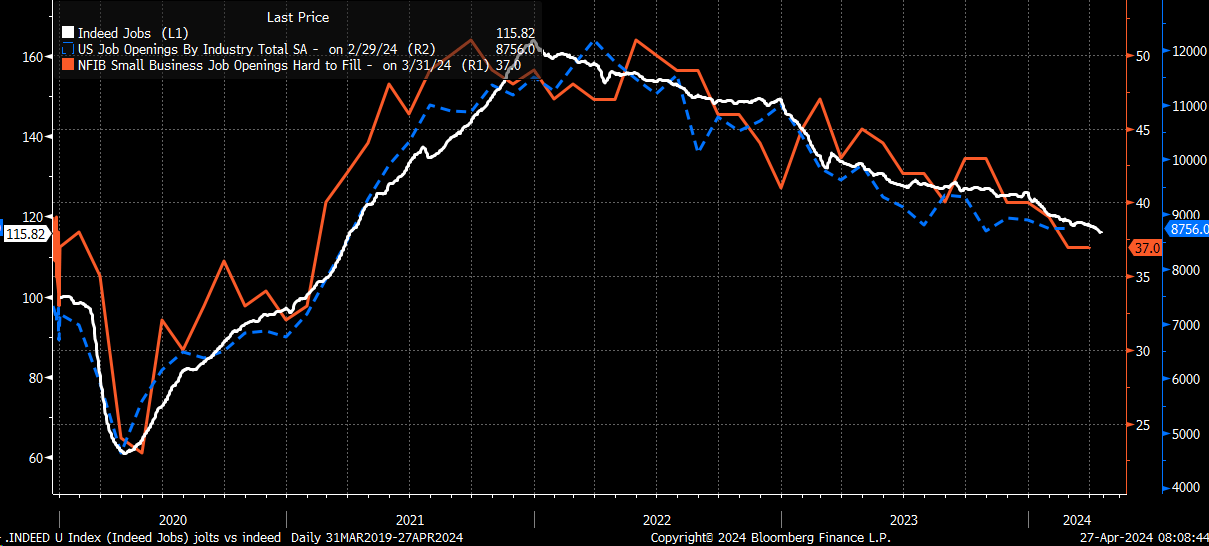
Meanwhile, both ADP and the BLS suggest that wage growth continued to slow in the first quarter but at a much slower pace than in previous quarters. As the current analysts' ECI estimates suggest, wage growth may have even seen a minor uptick. The one thing to watch in the ADP report this week for April is whether wages continued to surge for workers finding new jobs. That rose sharply in March to 10% from 7.6% in February.
Bloomberg
The prices paid index of ISM manufacturing may be more important than whether the sector expanded. The prices paid index in the ISM report is highly correlated with commodities such as copper, and copper prices rose dramatically in April, so a number that comes in hotter than expected on the ISM prices paid index would not be surprising.
Bloomberg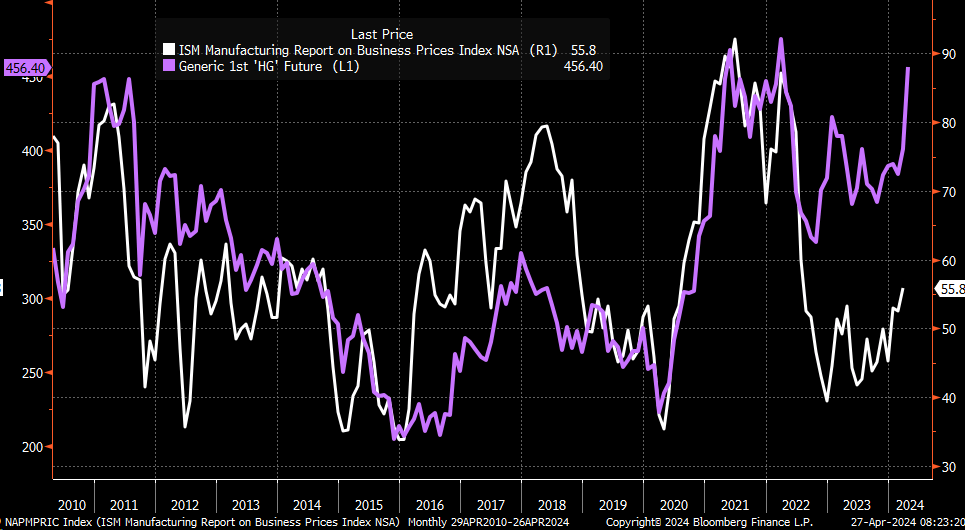
On Thursday, non-farm productivity is expected to slow down, dropping to 0.8% in the first quarter from 3.2% in the fourth quarter. Meanwhile, unit labor costs are expected to rise to 3.3% from 0.4% in the fourth quarter.
Friday will bring us the Job report, which is expected to show that non-farm payrolls increased by 250,000 in April from 303,000 in March, while the unemployment rate remained at 3.8%. Average hourly earnings are expected to remain unchanged at 0.3% m/m and fall to 4.0% y/y from 4.1% in March.
Analysts have poorly predicted job creation in prior months. Since April 2022, analysts have only overestimated the number of jobs created three times out of 24 reports.
Bloomberg
Last week, we saw hotter PCE numbers, while GDP came below Wall Street estimates and models such as the Atlanta Fed. However, the surprise in the PCE report was enough to push 10-year rates higher by four bps. In comparison, the 2-year rose by about one bps — additionally, the market repriced rate cut expectations, with the first-rate cut not taking place until December.
Bloomberg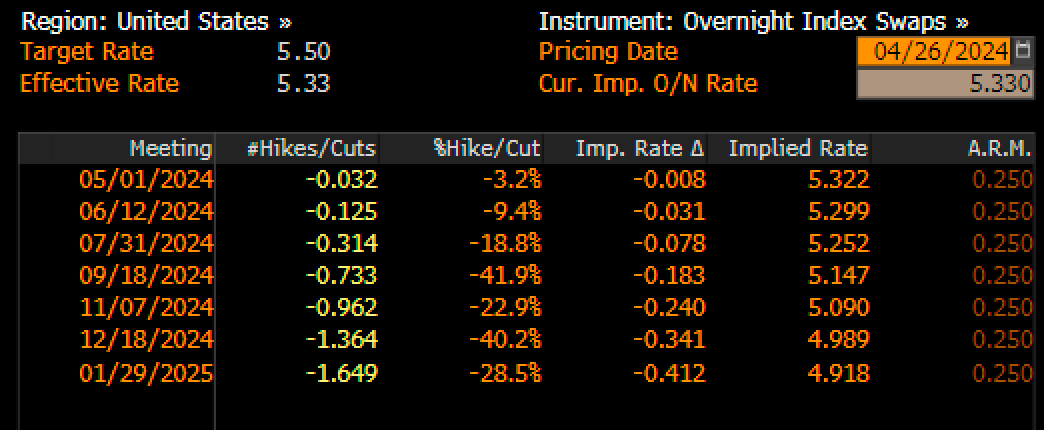
Higher Rates, Stronger Dollar
The technicals still point to higher rates on the 10-year Treasury moving higher as they push beyond a resistance level of around 4.65%, with the next significant level of resistance not coming until 5%. The one significant risk is the Treasury's quarterly refunding announcement, which is coming at 8:30 AM on May 1. However, expectations are for no changes to auction sizes, and it is not expected to be as big of an event as in past quarters.
TradingView
Meanwhile, the dollar index continues to show bullish trends and appears to be now trying to break out of a short-term bull flag. This would suggest that the dollar index moves higher and surpasses a resistance level at the 107 area to as high as 107.90 in the days and weeks ahead. This would leave the dollar on track to climb back to 113 on the index.
TradingView
Higher rates and the stronger dollar should lead to the CDX high-yield spread index continuing to increase, and the shift from the Fed at Wednesday's FOMC meeting that confirms fewer rate cuts are likely and that inflation has stalled out should lead to further spreads.
Bloomberg
The S&P 500 has been trading with credit spreads for a long time, so if rates rise, the dollar strengthens and spreads rise, then the S&P 500 earnings yield should climb. This would imply that financial conditions are tightening and that stock prices will continue the trend lower that started a couple of weeks ago.
Bloomberg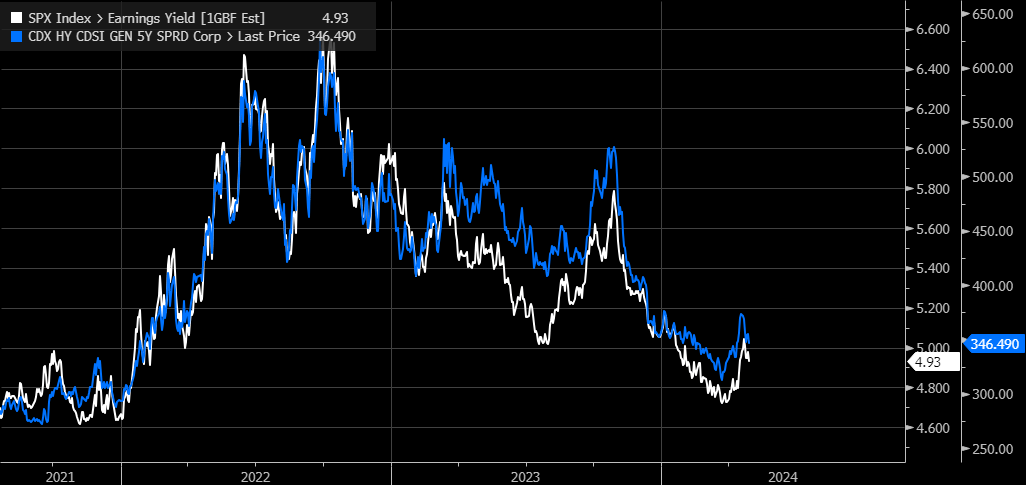
Of course, this is all data-dependent, and if data is weaker than expected, yields fall, the dollar weakens, spreads fall, and stock prices rise. But at present, the technicals suggest higher rates and a stronger dollar, which implies wider (higher) spreads and lower stock prices because the economic fundamentals are heating up, and that will require tighter financial conditions to prevent inflation from getting out of control again.
Join Reading The Markets Risk-Free With A Two-Week Trial!
(*The Free Trial offer is not available in the App Store)
Reading the Markets helps readers cut through all the noise, delivering daily video and written market commentaries to prepare you for upcoming events.
We use a repeated and detailed process of watching the fundamental trends, technical charts, and options trading data. The process helps isolate and determine where a stock, sector, or market may be heading over various time frames.