The behavior of gold, silver and base metals is a lifelong study for portfolio managers and analysts in Canada. Good money can be made for clients at major turning points, and of course dastardly losses are experienced when momentum shifts unexpectedly. Experienced professionals usually time these shifts by the seat of their pants, and below I'll explain why. I published a piece Jan. 8, 2013 when I considered gold a short. Now it is time to go long again.
Record inflows into ETPs in general, while commodity ETFs suffer large redemptions is a flag to take seriously. Why? In my long experience money is pretty much always moving in the wrong direction. I once made a presentation to the Okanagan (in British Columbia, Canada) Chartered Financial Analysts Annual Forecast dinner. Rather than cite supply and demand statistics, inflation data or technical charts, I asked the audience if they thought gold would be up or down the next year. Nobody raised their hand for "up" and so I flippantly predicted the price of gold would likely end the year higher by (an on-the-spot guess) of 20%. Turned out I was invited back to be congratulated for my accurate prediction.
My own experience has taught me indicators that may seem sensible don't usually measure up quantitatively. That said, it is possible to leverage the momentum of precious metals once in motion. For example, what casual observation suggests - that silver can provide a slingshot by outperforming gold at times - does work.
A useful (this is not an earth shattering revelation) metric is the gold-to-silver ratio. At gold troughs the gold-to-silver ratio is quite high, and at peaks it is lower.
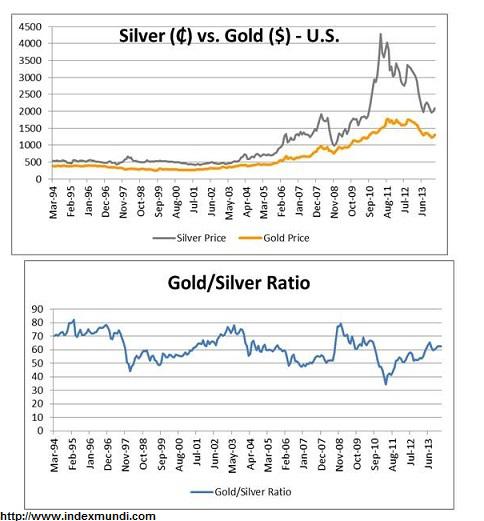
Another way of looking at it is that in bear markets for gold, silver performs worse than gold, and in bull markets silver performs better. To confirm this, one needs only examine the statistical volatility of silver versus gold over time. For example, the following chart is meant to simply illustrate that the standard deviation of monthly returns for silver is wider than gold. We can take for granted that the directional correlation is very robust.

If we could only determine with confidence the direction of gold prices, we can go long silver for the slingshot effect. Over my thirty years as a money manager, I've read more impotent theories explaining gold price direction than I can count. More demand drives it up to be sure, but what causes this to occur is still pretty much a mystery to me.
For instance, try using 'explanatory' variable like the change in the direction of interest rates, or the CPI. You can estimate formulas, but the statistical fit (R-squared of .0007) is so poor they're meaningless.

Easier to just watch and make a judgment. For example, when Apple (AAPL) was every investor's top pick, the sensible bet was that something might go wrong. I wrote about this back in July of 2012. More recently, I posted the same about Tesla (TSLA).
Making decisions when the opposite occurs is just as fruitful. When the sentiment is overtly negative and the flow of funds is still moving out, but the commodity price is moving up (oversold) it's time to get long. This just out from Bloomberg:
It doesn't matter that there's no 'apparent' reason for gold to be moving, it just is. So be long or be wrong. Soon enough (when the gold-to-silver ratio is at or above 70X) it will be wise to flip into silver instead. In December of '08 the gold-sales ratio was 79X. By April '11, it had declined to 35X. During that time frame the price of bullion climbed over 40%, and the silver price rocketed by over 300%. Now that's a slingshot!
Disclosure: I have no positions in any stocks mentioned, and no plans to initiate any positions within the next 72 hours. I wrote this article myself, and it expresses my own opinions. I am not receiving compensation for it (other than from Seeking Alpha). I have no business relationship with any company whose stock is mentioned in this article.