Over the last few years, there has been a wave of US IPO and ADR listings by China companies, seeking better valuation and global investors base. These companies spanned across different industries, from restaurants, healthcare companies, online retailers, education providers to travel agencies. I wonder what would be the industry that drives the next wave of US listing. Perhaps it will be the film industry - it has a great consumption growth angle, and strong demand for capital to fund productions that may take several years to monetize. More importantly, I think that the US equity market provides a global stage for China film studios to gain the international recognition that may give rise to business opportunities.
It is interesting to note that according to Bloomberg news, DMG Entertainment, the Chinese film and TV company that helped make "Iron Man 3," is seeking acquisitions and co-production deals in Hollywood as part of an expansion that includes a share listing in its home country. DMG is one example of a film studio that has been seeking to go IPO in China but the government's 14-month ban on IPO (to crack down on misconduct) delayed the listing. I expect more China film studios to tap into the capital market, and U.S. will be an attractive destination. Here is why: China restricts the number of international films distributed there and limits the producer's share of box-office receipts to 25 percent. Studios co-producing a film with a Chinese company can avoid such restrictions. China film studios seeking U.S. IPO will have a great investment story to tell - they are indispensable to Hollywood film makers because of protectionism, and China is a key emerging market where Hollywood film makers must go. China's box office takings were US$3.6 billion in 2013, which is approximately one third of the North American total according to The Hollywood Reporter.
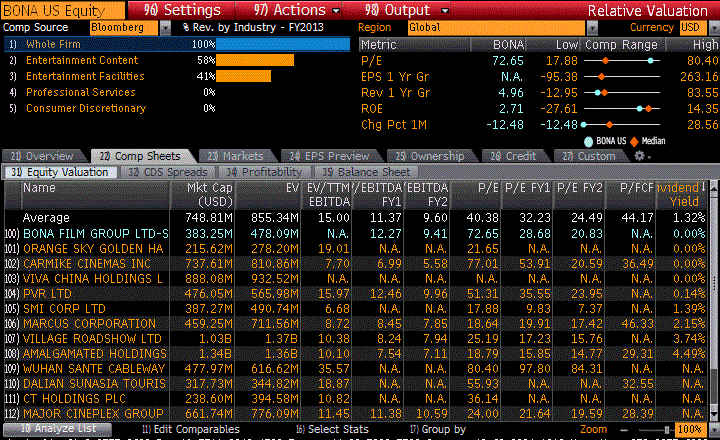
I think that as more China film studios list in the U.S., companies like Bona Film (BONA) will see re-rating as the China film industry become better understood by the North American investors. According to Bloomberg, BONA is trading at less than 1x price to book and 1.7x price to sales. BONA is a non state-owned film company that has multiple businesses including film production, distribution, talent agency and cinema operation. Distribution of foreign films is highly regulated and the state-owned enterprises dominate the distribution. Liberalization of the film market will be a major opportunity for non state-owned companies like BONA. State-owned enterprises have historically dominated the distribution of domestic films (top three enterprises have >40% market share) and some of them have exclusive rights to distribute foreign films.
BONA is a leading distributor of domestic films among all privately owned film distributors in China in terms of the number of films distributed and total box office receipts. I believe that an established player like BONA would have access to the right industry participants who would help the company in identifying and securing the distribution rights for promising film projects. Interestingly, BONA also selectively invests in film production projects by funding a portion of the film production budget in order to augment the supply of desirable film projects that it can distribute.
One should not underestimate the importance of local expertise in the film distribution business. A company's ability to maximize the value of the films is dependent on how well it manages its relationship with theatre circuits. A distributor grants exhibition rights to theatre circuits throughout China, often on a film-by-film basis. Hence, a distributor has more bargaining power in getting the films it wants if it has a strong relationship with theatres. I would think that BONA and another China listed company called Huayi Brothers are probably among the strongest non state-owned film companies in terms of theatrical channel.
Will the film distribution industry see consolidation just like other fast growth consumer categories? I believe the answer is yes. Based on the experience from developed Western markets, there is no shortage of theatres and film distributors have to stay on top of the competition by upgrading the theatres to attract traffic. I think that the upgrade of theatre infrastructure and exit of financially weak players will become more apparent in the major cities first.
There is no better way to invest in an emerging market than investing into the lifestyle upgrade of a rising middle class. BONA owns and operate movie theatres in major cities. I believe that urbanization and rising disposable income will spur the growth of movie theatres. BONA is just one investment idea. I will definitely watch this space for interesting IPO opportunities in future.
| Bona Film Group | ||||||
| (US$m) | FY08 | FY09 | FY10 | FY11 | FY12 | FY13 |
| Assets | ||||||
| + Cash & Near Cash Items | 5 | 7 | 84 | 20 | 23 | 33 |
| + Short-Term Investments | 0 | 0 | 0 | 6 | 0 | 0 |
| + Accounts & Notes Receivable | 5 | 19 | 15 | 42 | 40 | 39 |
| + Inventories | 0 | 0 | 0 | 0 | 0 | 0 |
| + Other Current Assets | 4 | 7 | 18 | 33 | 29 | 50 |
| Total Current Assets | 14 | 34 | 118 | 101 | 93 | 122 |
| + LT Investments & LT Receivables | 0 | 0 | 0 | 0 | 1 | 1 |
| + Net Fixed Assets | 0 | 0 | 14 | 40 | 60 | 64 |
| + Gross Fixed Assets | 1 | 1 | 17 | 45 | 69 | 78 |
| - Accumulated Depreciation | 0 | 1 | 3 | 5 | 9 | 14 |
| + Other Long-Term Assets | 11 | 33 | 99 | 133 | 162 | 233 |
| Total Long-Term Assets | 11 | 33 | 113 | 173 | 223 | 298 |
| Total Assets | 25 | 67 | 231 | 274 | 317 | 420 |
| Liabilities & Shareholders' Equity | ||||||
| + Accounts Payable | 4 | 9 | 10 | 28 | 35 | 25 |
| + Short-Term Borrowings | 0 | 21 | 34 | 31 | 36 | 65 |
| + Other Short-Term Liabilities | 7 | 12 | 22 | 31 | 36 | 89 |
| Total Current Liabilities | 12 | 42 | 65 | 89 | 108 | 178 |
| + Long-Term Borrowings | 1 | 2 | 6 | 0 | 18 | 20 |
| + Other Long-Term Liabilities | 3 | 3 | 0 | 1 | 1 | 19 |
| Total Long-Term Liabilities | 4 | 4 | 6 | 1 | 19 | 39 |
| Total Liabilities | 16 | 47 | 71 | 91 | 127 | 217 |
| + Total Preferred Equity | 8 | 19 | -- | 0 | 0 | 0 |
| + Minority Interest | 1 | 1 | 2 | 3 | 4 | 2 |
| + Share Capital & APIC | 4 | 4 | 166 | 170 | 176 | 183 |
| + Retained Earnings & Other Equity | (4) | (3) | (8) | 10 | 10 | 18 |
| Total Equity | 9 | 20 | 160 | 183 | 190 | 203 |
| Total Liabilities & Equity | 25 | 67 | 231 | 274 | 317 | 420 |
| Source: Bloomberg |
| (US$m) | FY08 | FY09 | FY10 | FY11 | FY12 | FY13 |
| Revenue | 23.4 | 38.4 | 52.8 | 126.2 | 142.3 | 149.3 |
| - Cost of Revenue | 12.7 | 19.9 | 26.5 | 66.5 | 86.1 | 82.8 |
| Gross Profit | 10.7 | 18.5 | 26.3 | 59.7 | 56.2 | 66.5 |
| - Operating Expenses | 7.0 | 12.9 | 17.1 | 47.0 | 57.0 | 57.9 |
| Operating Income | 3.7 | 5.6 | 9.2 | 12.7 | (0.8) | 8.6 |
| - Interest Expense | 0.0 | 0.0 | 0.4 | 0.6 | 0.4 | 1.4 |
| - FX Losses (Gains) | (0.3) | 0.1 | (0.0) | (1.7) | (0.4) | (1.8) |
| - Net Non-Op. Losses | 2.5 | (0.4) | 12.9 | (1.2) | (0.5) | (0.6) |
| Pretax Income | 1.5 | 5.8 | (4.1) | 15.0 | (0.2) | 9.7 |
| - Income Tax Exp. | 1.1 | 0.3 | 0.1 | 0.5 | 1.3 | 5.1 |
| Inc. Before XO Items | 0.4 | 5.5 | (4.2) | 14.6 | (1.6) | 4.5 |
| - Extraordinary Loss Net of Tax | 0.0 | 0.0 | 0.0 | 0.0 | 0.0 | 0.0 |
| - Minority Interests | 0.2 | (0.2) | (0.1) | 0.1 | (0.3) | (1.1) |
| Net Income | 0.2 | 5.6 | (4.1) | 14.4 | (1.3) | 5.7 |
| - Total Cash Preferred Dividends | 0.9 | 1.4 | 2.2 | 0.0 | 0.0 | 0.0 |
| - Other Adjustments | 0.0 | 0.0 | 0.0 | 0.0 | 0.0 | 0.0 |
| Net Inc Avail to Common Shareholders | (0.6) | 4.2 | (6.2) | 14.4 | (1.3) | 5.7 |
| Abnormal Losses (Gains) | 0.0 | 0.0 | (0.5) | 0.0 | 0.0 | 0.0 |
| Tax Effect on Abnormal Items | 0.0 | 0.0 | 0.2 | 0.0 | 0.0 | 0.0 |
| Normalized Income | (0.6) | 4.2 | (6.6) | 14.4 | (1.3) | 5.7 |
| Basic EPS Before Abnormal Items | (0.07) | 0.27 | (0.27) | 0.25 | (0.04) | 0.10 |
| Basic EPS Before XO Items | (0.07) | 0.27 | (0.25) | 0.25 | (0.04) | 0.10 |
| Basic EPS | (0.07) | 0.27 | (0.25) | 0.25 | (0.04) | 0.10 |
| Basic Weighted Avg Shares | 9.05 | 8.45 | 25.52 | 58.71 | 59.03 | 59.74 |
| Diluted EPS Before Abnormal Items | (0.07) | 0.27 | (0.27) | 0.24 | (0.04) | 0.10 |
| Diluted EPS Before XO Items | (0.07) | 0.27 | (0.25) | 0.24 | (0.04) | 0.10 |
| Diluted EPS | (0.07) | 0.27 | (0.25) | 0.24 | (0.04) | 0.10 |
| Diluted Weighted Avg Shares | 9.05 | 8.52 | 25.52 | 59.69 | 59.03 | 60.87 |
| Source: Bloomberg |
| (US$m) | FY08 | FY09 | FY10 | FY11 | FY12 | FY13 |
| Cash From Operating Activities | ||||||
| + Net Income | 0.2 | 5.6 | (4.1) | 14.4 | (1.3) | 5.7 |
| + Depreciation & Amortization | 9.2 | 13.8 | 20.8 | 42.2 | 48.9 | 5.7 |
| + Other Non-Cash Adjustments | 2.7 | 0.8 | 14.6 | 5.4 | 5.4 | (40.9) |
| + Changes in Non-Cash Capital | (14.3) | (44.6) | (63.7) | (59.7) | (62.5) | 7.9 |
| Cash From Operations | (2.2) | (24.3) | (32.4) | 2.2 | (9.5) | (21.6) |
| Cash From Investing Activities | ||||||
| + Disposal of Fixed Assets | 0.0 | 0.0 | 0.0 | 0.0 | 0.0 | 0.0 |
| + Capital Expenditures | (0.2) | (0.1) | (2.7) | (12.2) | (17.6) | (9.7) |
| + Increase in Investments | 0.0 | 0.0 | 0.0 | (7.3) | 0.0 | (26.1) |
| + Decrease in Investments | 0.0 | 0.0 | 0.0 | 0.0 | 0.0 | 0.0 |
| + Other Investing Activities | (4.7) | (0.6) | (5.7) | (29.3) | (0.6) | (25.6) |
| Cash From Investing Activities | (4.9) | (0.6) | (8.4) | (48.8) | (18.2) | (61.3) |
| Cash from Financing Activities | ||||||
| + Dividends Paid | 0.0 | 0.0 | 0.0 | 0.0 | 0.0 | 0.0 |
| + Change in Short-Term Borrowings | 0.0 | 12.4 | 9.6 | (9.9) | 24.0 | 0.0 |
| + Increase in Long-Term Borrowings | 1.3 | 8.6 | 10.8 | 4.0 | 0.3 | 123.6 |
| + Decrease In Long-Term Borrowings | 0.0 | (0.3) | (4.4) | (4.8) | (1.5) | (31.6) |
| + Increase in Capital Stocks | 0.0 | 9.0 | 7.0 | 0.2 | 1.8 | 2.5 |
| + Decrease in Capital Stocks | 0.0 | (3.5) | 0.0 | 0.0 | 0.0 | 0.0 |
| + Other Financing Activities | 3.9 | 1.4 | 94.6 | (7.0) | 0.2 | (2.2) |
| Cash from Financing Activities | 5.2 | 27.6 | 117.7 | (17.6) | 24.8 | 92.3 |
| Net Changes in Cash | (1.9) | 2.6 | 76.8 | (64.1) | (2.9) | 9.5 |
| Source: Bloomberg |