The global economic expansion scenario remains intact, which will continue to support copper prices. Based on a Morgan Stanley estimate, the annual copper consumption growth for FY2011 and FY2012 is 8.5% and 6.7%, respectively.
In addition, the floor space under construction in China is closely correlated with copper consumption (see Chart I); the recent surge of the floor space under construction should support copper consumption.
Chart I: Floor space under construction closely correlates with copper consumption
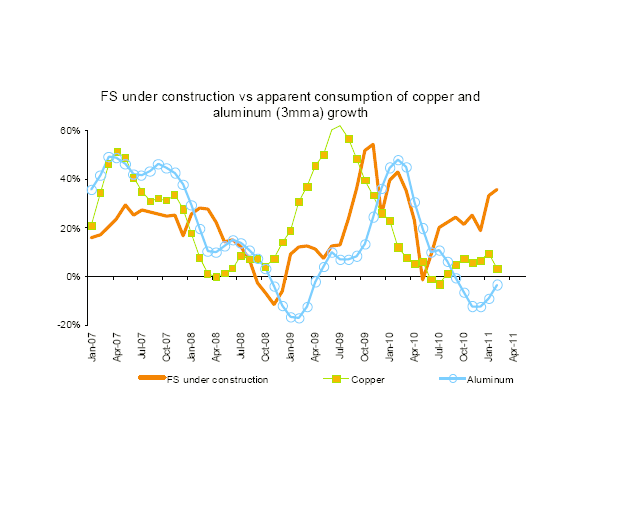
Source: CEIC, Morgan Stanley Research
According to the International Copper Study Group (ICSG), an intergovernmental organization that serves to increase copper market transparency, copper supply would remain constrained, given that the industry has struggled with ageing mines, falling grades, rising operational costs, and rising capital intensity per tonne of output. From 2004 to 2010, the global copper usage has increased by 14.9%, but the production output has risen by only 4.2% (see Chart II).
Chart II: Year-on-year growth in copper consumption and mined production, 2008-2010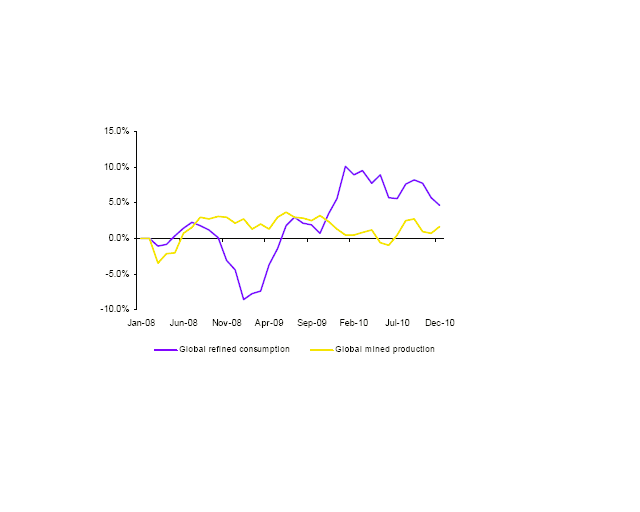
Source: ICSG, Morgan Stanley Research
ICSG data show a continuous decline of copper’s stock-to-consumption ratio, from 31.4 days in January 2010, to the current 27.0 days, below the long-run clearing rate of 29.6 days (See Chart III).
Chart III : Copper stock to consumption ratio, 1995-2011 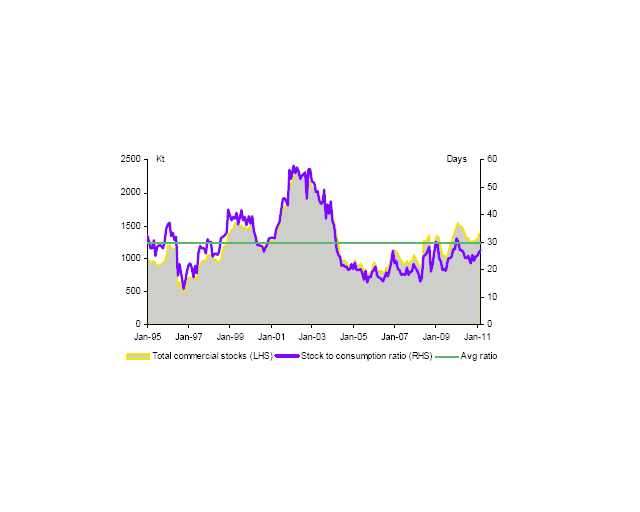
Source: ICSG, Wood Mackenzie Brook Hunt, Morgan Stanley Research
Copper has still a lot of upside potential the coming years. In 2010, copper locked in a second consecutive annual gain of nearly 33 percent as demand remained elevated due to growth in China and other emerging markets and of course a weak dollar.
Global exchange inventories of copper declined by nearly 22% in 2010 and stockpiles are expected to drop further the coming years because of exhausted deposits. Furthermore, new mining and production projects are too small and insufficient to make up for the shrinking volumes