 Comcast Corporation (NASDAQ:CMCSA), founded in 1969, is a provider of consumer entertainment, information, and communication products and services. Pennsylvania-based company operates in two segments: Cable and Programming. The company also operates Internet businesses on entertainment, information and communication services, such as Comcast.net, Fancast, thePlatform, Fandango, Plaxo, and DailyCandy.
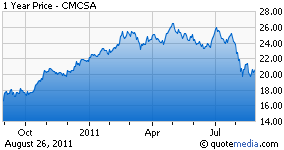
As of August 26th, Comcast stock was trading at $20 with a 52-week range of $16.76 – $27.16. It has a market cap of $56.4 billion. Trailing twelve month P/E ratio is 14.7, and forward P/E ratio is 10.6. P/B, P/S, and P/CF ratios stand at 1.2, 1.3, and 4.5, respectively. The 3-year annualized revenue and EPS growth stand at 7.1% and 15.8%, respectively. Operating margin is 20%, and net profit margin is 8.4%. The company has a high debt-to-equity ratio of 0.8. Comcast has a yield of 2.22% for its shareholders.
Comcast has a 4-star rating from Morningstar. While its trailing P/E ratio is 14.7, it has a 5-year average P/E ratio of 22.5. Out of 27 analysts covering the company, 13 have buy, 6 have outperform, and 7 have hold ratings. Wall Street has diverse opinions on Comcast’s future. The bottom line is -8.9% growth, whereas the top-line growth estimate is 58.6% for the next year. Average five-year annualized growth forecast estimate is 12.4%.
What is the fair value of Comcast given the forecast estimates? In this article, the 13th in the series, I will show a step-by-step calculation of Comcast’s fair value using discounted earnings plus equity model.
Discounted Earnings Plus Equity Model
This model is primarily used for estimating the returns from long-term projects. It is also frequently used to price fair-valued IPOs. The methodology is based on discounting the present value of the future earnings to the current period:
V = E0 + E1